Information and updates about the Greater Hamilton Area Real Estate market conditions
March 16, 2026
Erin
Local Hamilton Market Statistics General Real Estate Advice Real Estate Trends

The Cornerstone Association of REALTORS® (Cornerstone) has released its February 2026 real estate statistics, showing signs of greater stability across the Hamilton-Burlington-Haldimand-Niagara North market area. Home sales increased 7.4% month-over-month, while newly listed properties edged down 2.0% compared to January.
Inventory remained elevated in February, with the overall supply rising 2.2% year-over-year and reaching 3.5 months of supply across all property types by month-end. For buyers, that means more choice and more time to make decisions, while sellers continue to navigate a more competitive environment.
The MLS® Home Price Index (HPI) rose 1.6% month-over-month in February, marking its second straight monthly increase, although it remained 7.9% below February 2025 levels. This suggests the market may be starting to find more balance after the price adjustments seen over the past year.
As Bill Duce, CEO of Cornerstone, noted, “With inventory levels up and a modest month-over-month increase in sales, the Hamilton-Burlington market area is showing signs of stability.” He also pointed to the recent HPI gains as a sign the market may be moving toward a new equilibrium.
This Hamilton real estate market report for February 2026 will highlight:
- Regional trends in sales, new listings, inventory, and home prices
- What current supply levels reveal about market conditions
- What February’s market means for buyers and sellers
- A closer look at Hamilton and Burlington activity
Coming Up: Hamilton + Burlington Combined Market Snapshot – February 2026
Next, we’ll look at the combined Hamilton + Burlington market snapshot for February 2026, then move into a more focused breakdown of Hamilton market trends.
Hamilton + Burlington Combined Market Snapshot – February 2026
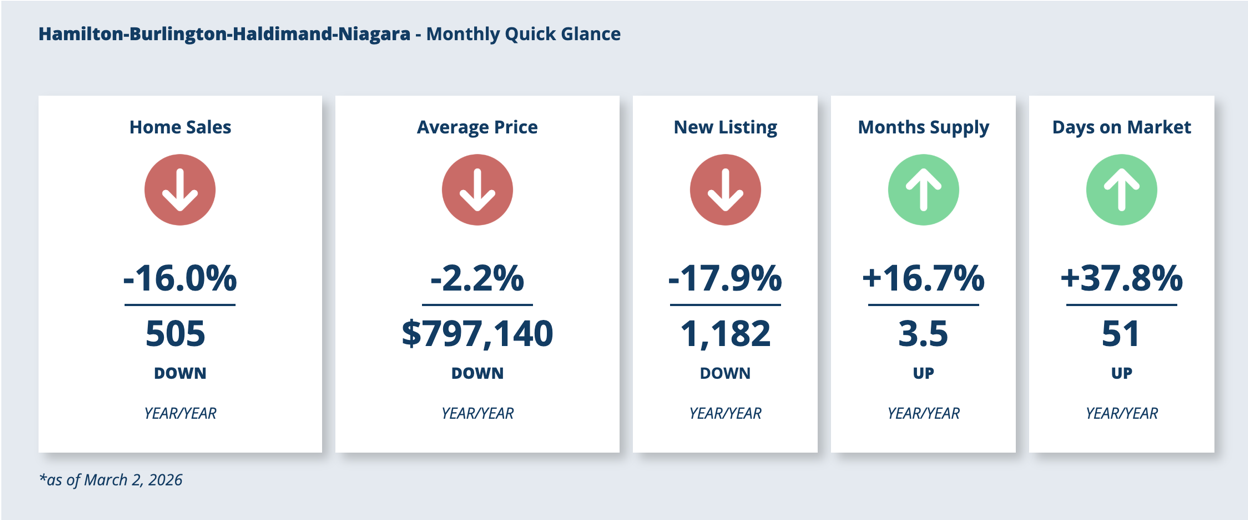
The Hamilton-Burlington-Haldimand-Niagara North market continued to show more balanced conditions in February, with buyers benefiting from increased choice and a slower pace than last year’s market. Across the region, 505 homes sold, down 16.0% year-over-year, while 1,182 new listings were added to the market, a 17.9% decline compared to February 2025.
The average price reached $797,140 in February, down a modest 2.2% year-over-year, while the months of supply rose to 3.5, up 16.7% from last year. Homes also took longer to sell, with average days on market climbing to 51 days, a 37.8% increase year-over-year. Altogether, these trends reflect a market that remains active, but with more time and flexibility for buyers and more competition for sellers.
Hamilton-Burlington-Haldimand-Niagara North Area Highlights
- Sales: 505 (↓ 16.0% year-over-year)
- New listings: 1,182 (↓ 17.9% year-over-year)
- Average price: $797,140 (↓ 2.2% year-over-year)
- Months of supply: 3.5 (↑ 16.7% year-over-year)
- Average days on market: 51 days (↑ 37.8% year-over-year)
Average Price Snapshot by Area
- Hamilton: $718,545 (↓ 6.1% year-over-year)
- Burlington: $1,066,177 (↑ 1.7% year-over-year)
- Haldimand County: $599,276 (↓ 13.8% year-over-year)
- Niagara North: $803,387 (↑ 5.7% year-over-year)
What this suggests right now: February’s regional numbers point to a market that’s becoming more measured and more balanced. Buyers have more room to compare options and move thoughtfully, while sellers can still achieve strong results when pricing, presentation, and strategy are aligned with current market conditions.
Coming Up: Hamilton Residential Real Estate Market – February 2026
Next, we’ll move into a closer look at the Hamilton residential real estate market, including sales, new listings, inventory, pricing trends, and what February’s results reveal at the local level.
Hamilton Residential Real Estate Market – February 2026
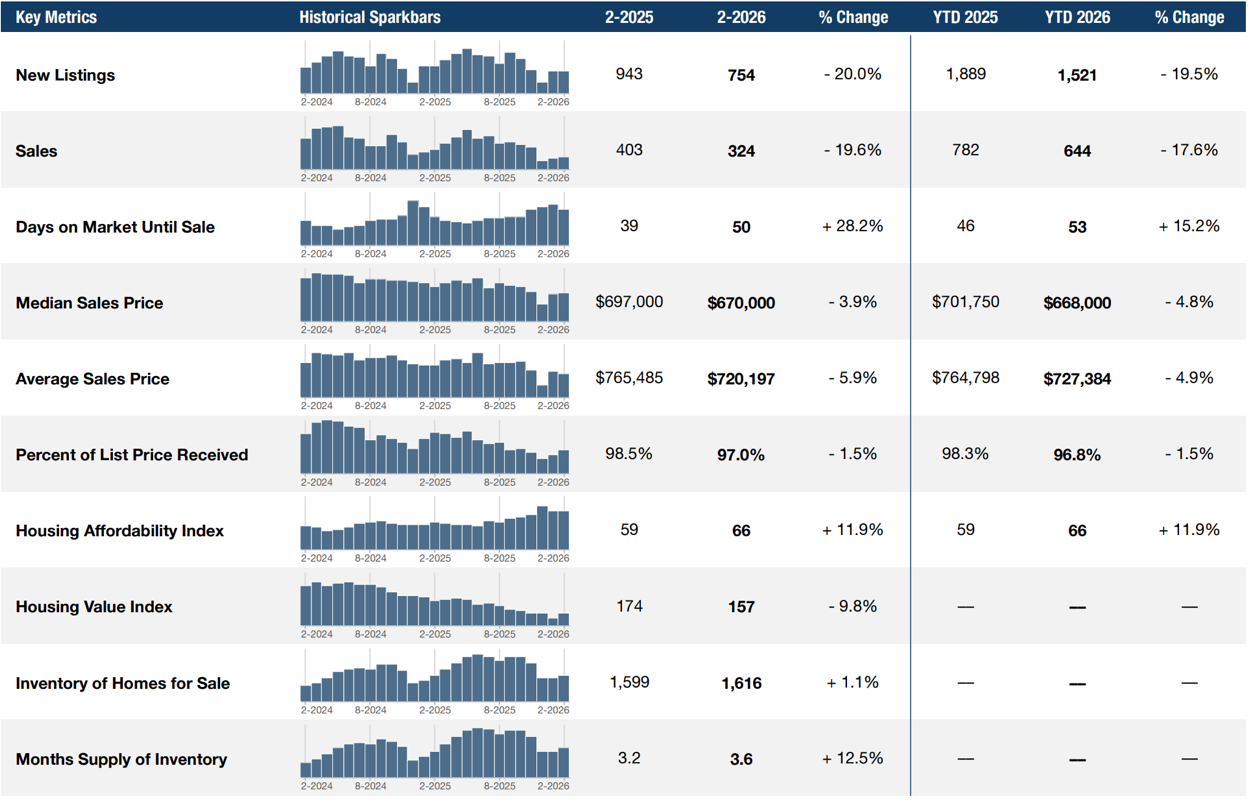
Hamilton’s residential real estate market continued at a more measured pace in February, with both sales and new listing activity remaining below last year’s levels. According to Cornerstone’s residential data, 324 homes sold in Hamilton, down 19.6% year-over-year, while 754 new listings were added to the market, a 20.0% decline compared to February 2025.
Market conditions also continued to shift toward a more balanced environment. Days on market until sale rose to 50 days, up 28.2% year-over-year, while active inventory reached 1,616 homes, a modest 1.1% increase over last year. This pushed months of supply to 3.6, up 12.5% year-over-year, giving buyers more time and more flexibility than in tighter market conditions.
Pricing remained softer year-over-year in February. The median sales price came in at $670,000, down 3.9%, while the average sales price was $720,197, down 5.9%. Sellers also received a slightly smaller share of the asking price on average, with the percent of list price received at 97.0%, compared to 98.5% last year.
Hamilton Residential Market Snapshot
- Sales: 324 (↓ 19.6% year-over-year)
- New listings: 754 (↓ 20.0% year-over-year)
- Days on market until sale: 50 (↑ 28.2% year-over-year)
- Median sales price: $670,000 (↓ 3.9% year-over-year)
- Average sales price: $720,197 (↓ 5.9% year-over-year)
- Percent of list price received: 97.0% (down from 98.5% or ↓ 1.5%)
- Inventory of homes for sale: 1,616 (↑ 1.1% year-over-year)
- Months of supply: 3.6 (↑ 12.5% year-over-year)
What this suggests right now: Hamilton’s residential market remains more balanced than it was a year ago. Buyers are benefiting from more time and a little more negotiating room, while sellers can still achieve solid results with accurate pricing and strong presentation.
Coming Up: Hamilton Market Breakdown by Housing Segment
Next, we’ll break down Hamilton’s February 2026 market performance by Single Family homes and Townhouse/Condo properties to see how sales, inventory, pricing, and time on market differed between these two housing segments.
Hamilton Market Breakdown by Housing Segment
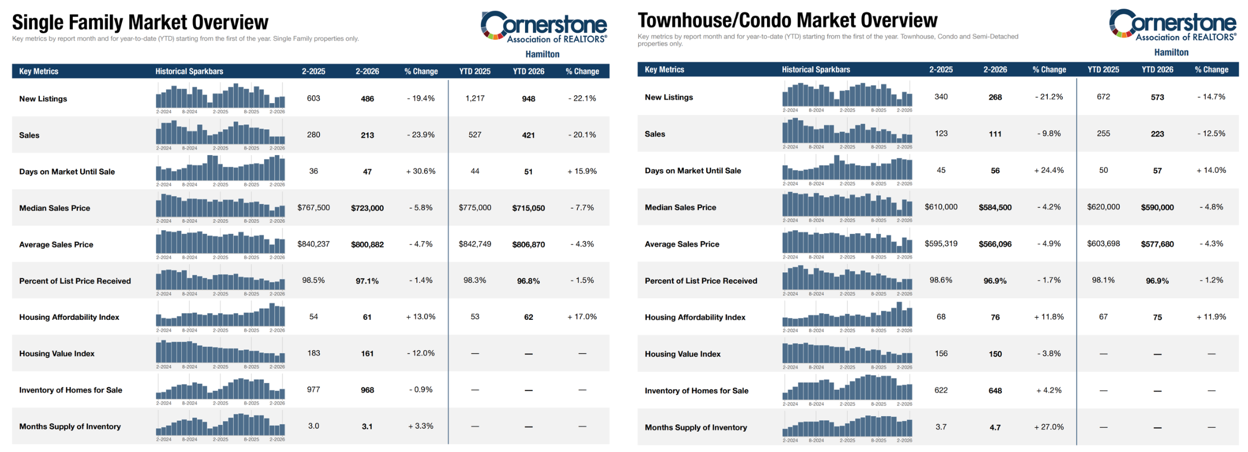
Hamilton’s February 2026 housing market showed softer activity across both major residential segments, with Single Family homes and Townhouse/Condo properties both seeing fewer new listings and fewer sales compared to last year.
The broader Canadian market also slowed in February, with the Canadian Real Estate Association (CREA) reporting a 5.8% month-over-month decline in home sales and a 16.2% year-over-year decrease on a non-seasonally adjusted basis, due in part to weather-related disruptions and weaker activity across Southwestern Ontario and the Greater Golden Horseshoe.
At the local level, Hamilton’s Single Family segment saw a sharper slowdown in sales activity, while the Townhouse/Condo segment experienced a larger increase in supply. Both segments also recorded lower prices and longer selling times year-over-year, reinforcing the shift toward more balanced conditions across the market.
Single Family Market Snapshot
- New listings: 486 (↓ 19.4% year-over-year)
- Sales: 213 (↓ 23.9% year-over-year)
- Days on market until sale: 47 (↑ 30.6% year-over-year)
- Median sales price: $723,000 (↓ 5.8% year-over-year)
- Average sales price: $800,882 (↓ 4.7% year-over-year)
- Percent of list price received: 97.1% (down from 98.5% or ↓ 1.4%)
- Inventory of homes for sale: 968 (↓ 0.9% year-over-year)
- Months of supply: 3.1 (↑ 3.3% year-over-year)
Single Family homes remained the higher-priced segment in Hamilton, but February’s numbers point to a slower pace than last year. Sales fell more than new listings, homes took longer to sell, and prices softened, suggesting that buyers in this segment are continuing to gain more time and negotiating room.
Townhouse/Condo Market Snapshot
- New listings: 268 (↓ 21.2% year-over-year)
- Sales: 111 (↓ 9.8% year-over-year)
- Days on market until sale: 56 (↑ 24.4% year-over-year)
- Median sales price: $584,500 (↓ 4.2% year-over-year)
- Average sales price: $566,096 (↓ 4.9% year-over-year)
- Percent of list price received: 96.9% (down from 98.6% or ↓ 1.7%)
- Inventory of homes for sale: 648 (↑ 4.2% year-over-year)
- Months of supply: 4.7 (↑ 27.0% year-over-year)
The Townhouse/Condo segment also saw softer pricing and slower movement in February, but the most notable shift was in supply. With inventory and months of supply rising more sharply than in the Single Family segment, buyers in this category are likely seeing more options and less pressure than they did a year ago.
What this suggests right now: February’s segment-level results show that both property types are adjusting to a more balanced market, though the shift is more pronounced in the Townhouse/Condo segment. Buyers across both categories have more time and flexibility, while sellers are likely to see the best results when pricing and presentation reflect current market conditions.
Coming Up: Hamilton District Snapshot: Prices & Sales by Area
Next, we’ll look at how sales and prices performed across Hamilton’s featured districts to highlight where market activity remained steadier and where conditions softened more noticeably in February.
Hamilton District Snapshot: Prices & Sales by Area
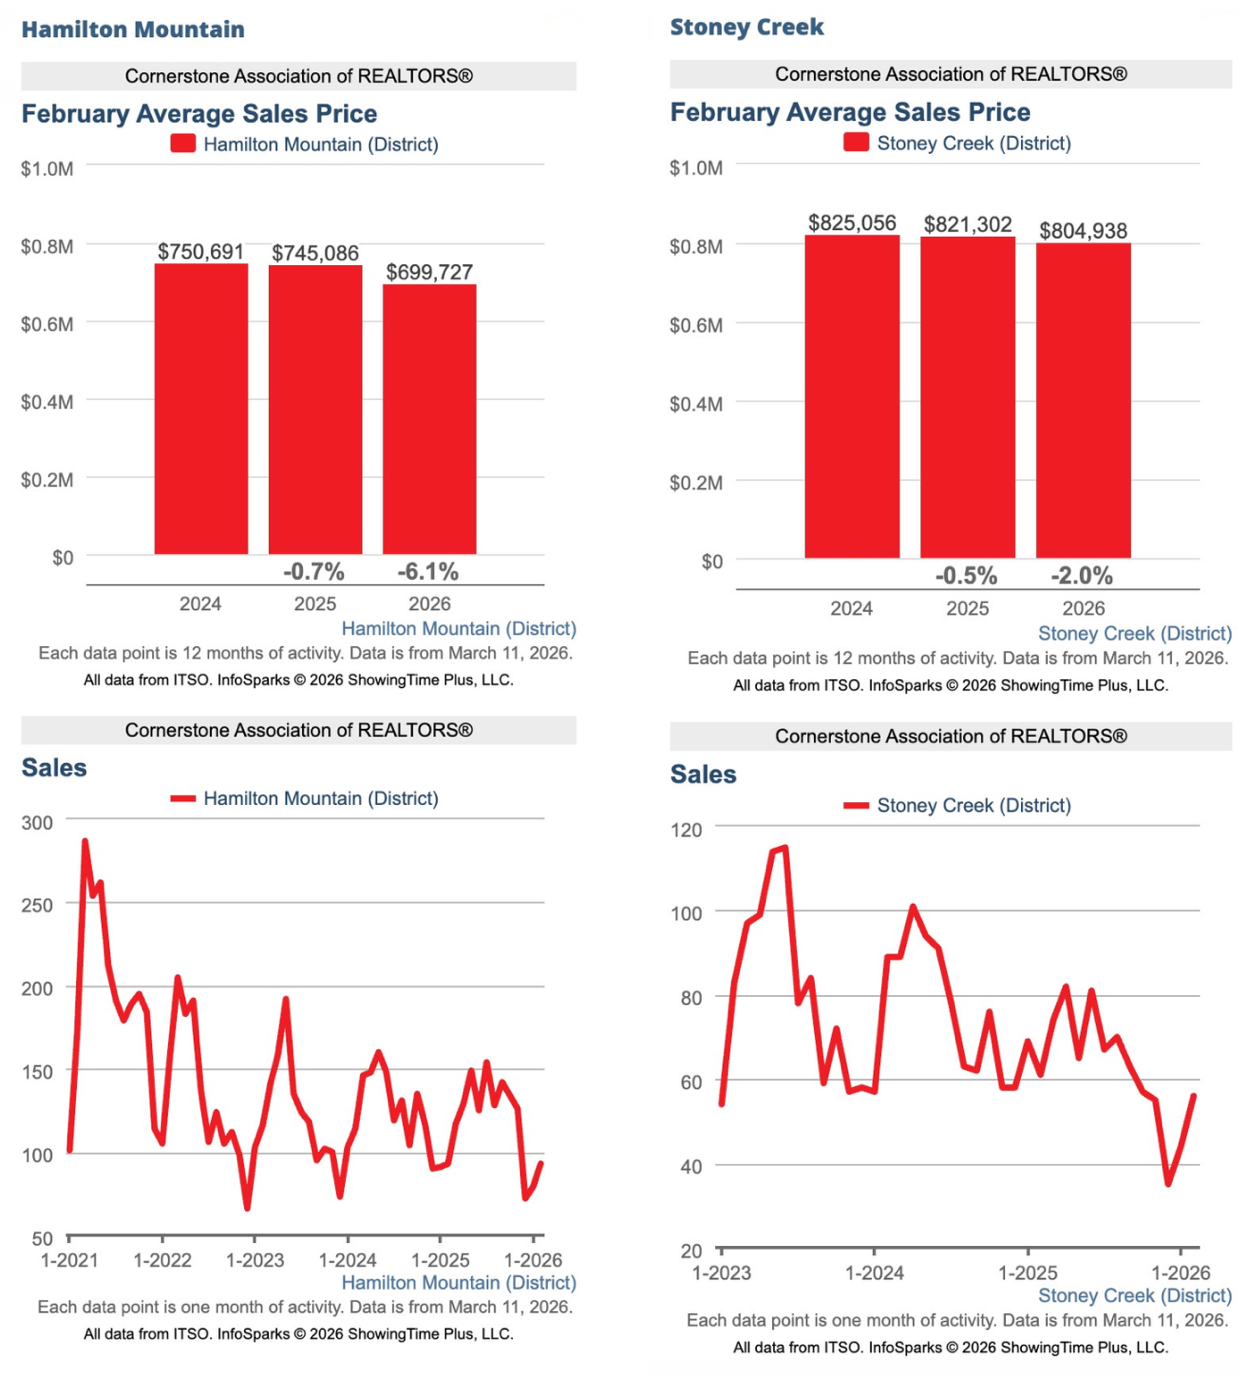
While city-wide trends provide the broader picture, district-level performance helps highlight where momentum was strongest in February. Sales activity was strongest in Hamilton Mountain and Stoney Creek, making these two districts the featured areas in this month’s report.
February 2026 District Highlights
- Hamilton Mountain: 93 sales, with an average sale price of $699,727 (↓ 6.1% year-over-year)
- Stoney Creek: 56 sales, with an average sale price of $804,938 (↓ 2.0% year-over-year)
Hamilton Mountain led all districts in sales activity in February with 93 sales, while Stoney Creek followed with 56 sales. Both districts saw solid market activity during the month, even as average prices adjusted modestly year-over-year within a more balanced Hamilton market.
What this suggests right now: Even within a softer overall market, demand continues to hold in established Hamilton areas. For buyers and sellers alike, neighbourhood-level trends remain an important part of understanding pricing, timing, and local market momentum.
Coming Up: Market Summary & What It Means for You
Next, we’ll bring February’s numbers together into key takeaways for buyers and sellers, and what they may mean if you’re planning a move in Hamilton in 2026.
Summary & Expert Insights: Hamilton Real Estate Market – February 2026
February brought more balanced conditions across the Hamilton-Burlington-Haldimand-Niagara North market area, with inventory remaining elevated and sales showing a modest month-over-month gain. The MLS® Home Price Index (HPI) also rose for the second straight month, suggesting the market may be moving toward greater stability after last year’s price adjustments.
Within the combined Hamilton-Burlington market snapshot, 505 homes sold in February, down 16.0% year-over-year, while 1,182 new listings were added, down 17.9%. The average price reached $797,140 (↓ 2.2% year-over-year), and days on market rose to 51 days, reflecting a slower, more measured pace.
Hamilton’s residential market followed a similar pattern. The city recorded 324 sales (↓ 19.6% year-over-year) and 754 new listings (↓ 20.0%), while months of supply rose to 3.6 and days on market until sale increased to 50 days. The average sales price came in at $720,197, while the median sales price was $670,000.
By housing segment, both Single Family homes and Townhouse/Condo properties saw lower sales, softer prices, and longer selling times than a year ago. Supply conditions remained more buyer-friendly in the Townhouse/Condo segment, while Hamilton Mountain and Stoney Creek led the city in sales activity at the district level.
As Bill Duce, CEO of Cornerstone, noted, “With more inventory to choose from and longer days on market, buyers are benefiting from more time and options.” That remained one of February’s clearest themes across both the broader regional market and Hamilton itself.
What This Means for You
- Buyers: More inventory and longer selling timelines mean more opportunity to compare options and negotiate with confidence.
- Sellers: Homes are still selling, but strategy matters more in a market where buyers have greater choice.
- Investors: More balanced conditions may create opportunities in segments where supply is rising and pricing has softened.
Up Next: Turning Market Insight Into Your Next Step
Whether you are planning to buy, sell, or simply stay informed, understanding the latest market trends is only part of the equation. Having trusted local guidance can help you put the data into context and move forward with greater confidence in the Hamilton real estate market.
Ready to Navigate the Hamilton Real Estate Market? Work With Judy Marsales Real Estate Brokerage
Whether you are buying, selling, or exploring your next move, working with a knowledgeable local real estate sales representative can make all the difference. Judy Marsales Real Estate Brokerage brings decades of experience, neighbourhood-level insight, and personalized service to clients across Hamilton, Dundas, Ancaster, Burlington, and surrounding areas.
Why Work With Judy Marsales Real Estate Brokerage
- Local market expertise backed by in-depth knowledge of Hamilton-area neighbourhoods and pricing trends
- Personalized real estate guidance for buyers, sellers, downsizers, and investors
- Current market insight to help you make confident, informed decisions in a changing market
Stay Connected
Follow Judy Marsales Real Estate Brokerage on Facebook and Instagram for local real estate market updates, new listings, open houses, and community news.
Get in Touch
Curious about your home’s current value in today’s Hamilton real estate market? Use the Home Value Calculator for a quick estimate, or reach out for a more detailed neighbourhood-specific evaluation. And for a broader context, you can also review Cornerstone’s February 2026 market statistics.
When you’re ready to buy or sell in the Hamilton real estate market, trust Judy Marsales Real Estate Brokerage for local expertise, personalized service, and results-driven strategy.
February 13, 2026
Erin
Local Hamilton Market Statistics General Real Estate Advice Real Estate Trends

Hamilton & Burlington Real Estate Market Update – January 2026
The Cornerstone Association of REALTORS® (Cornerstone) has released its January 2026 real estate statistics, showing a market where sales remain softer year-over-year, inventory is higher, and homes are taking longer to sell across the region. In total, 779 home sales were recorded through Cornerstone’s MLS® System in January, down 7.0% month-over-month and 21.9% year-over-year.
New listing activity also returned seasonally after December, with 2,173 new listings added in January (up sharply month-over-month, which is typical for this time of year). Inventory continued to rise, bringing the region to 3 months of supply by month-end—while average days on market reached 54 days, the highest level reported in over a decade.
“As homes stay on the market longer and interest rates stabilize, opportunities for buyers continue to improve,” says Bill Duce, CEO of Cornerstone.
This Hamilton & Burlington real estate market update for January 2026 will highlight:
- Regional trends in sales, new listings, and inventory
- What months of supply and days on market reveal about today’s pace and leverage
- What current conditions mean for buyers and sellers as we move through early 2026
Coming Up: Key Highlights From January’s Market Performance
Next, we’ll break down the combined Hamilton + Burlington regional totals, then move into a Hamilton-only market focus to highlight local trends, property types, and what they mean for your next move.
Hamilton & Burlington Combined Market Snapshot – January 2026
The Hamilton-Burlington market entered 2026 with a steadier month-to-month pattern, even as results remained softer than last year. Sales edged up slightly from December, while new listing activity rebounded sharply in a typical seasonal lift—giving buyers more choice and more time to evaluate options. Inventory levels also continued to trend higher year-over-year, keeping overall conditions closer to balanced and improving negotiating flexibility in many segments.
“The Hamilton-Burlington market is showing signs of stability with a slight month-over-month increase in sales despite the year-over-year decline. With homes staying on the market longer and inventory up by over 23% compared to last year, buyers have more options and potentially more negotiating power. The unchanged monthly HPI indicates we may be reaching a pricing plateau after the significant year-over-year adjustments we've seen.” — Bill Duce, Cornerstone CEO
Hamilton-Burlington Area Highlights
- Sales: 470 (↑ 1.5% month-over-month)
- New listings: 1,203 (↑ 119.9% month-over-month)
- Inventory: ↑ 23.1% year-over-year | Months of supply: 3.2
- MLS® HPI: unchanged month-over-month | ↓ 10.0% year-over-year
- Average days on market: 57 days
Average Price Snapshot (reported by area)
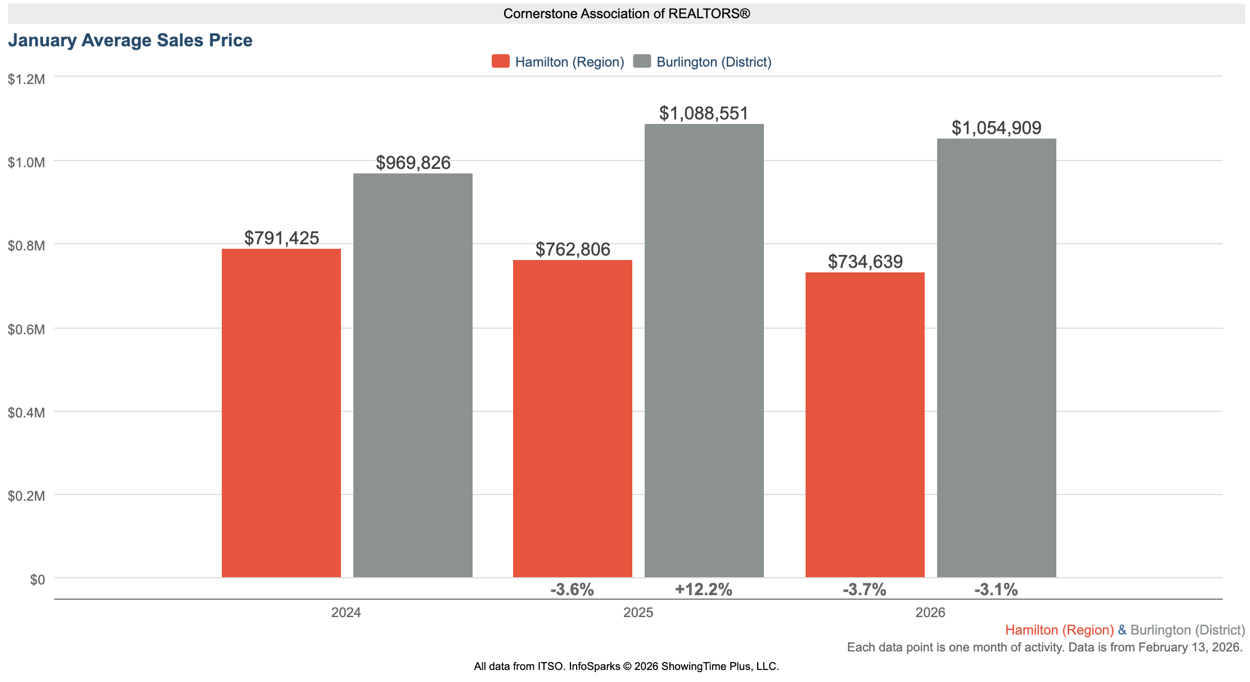
- Hamilton average price: $734,639 (↓ 3.7% year-over-year)
- Burlington average price: $1,054,909 (↓ 3.1% year-over-year)
What this suggests right now: With inventory up year-over-year and days on market elevated, buyers are generally seeing more breathing room. For sellers, results are still very achievable—especially when pricing is aligned with current conditions and presentation is strong—because the market is rewarding homes that show well and are positioned accurately from day one.
Coming Up: Hamilton Market Focus – January 2026
Next, we’ll move from the regional overview into a Hamilton-only breakdown, including sales, listings, inventory, and pricing—followed by a closer look at performance by property type and key district trends.
Hamilton Residential Real Estate: Price, Sales & Market Conditions
January opened with a quieter year-over-year pace in Hamilton, alongside a more measured national backdrop. The Canadian Real Estate Association (CREA) reported that Canadian home sales declined 2.7% month-over-month in January and were down 4.5% year-over-year, while inventory across Canadian MLS® Systems remained higher than last year—supporting conditions where many buyers have more choice and more time heading toward spring.
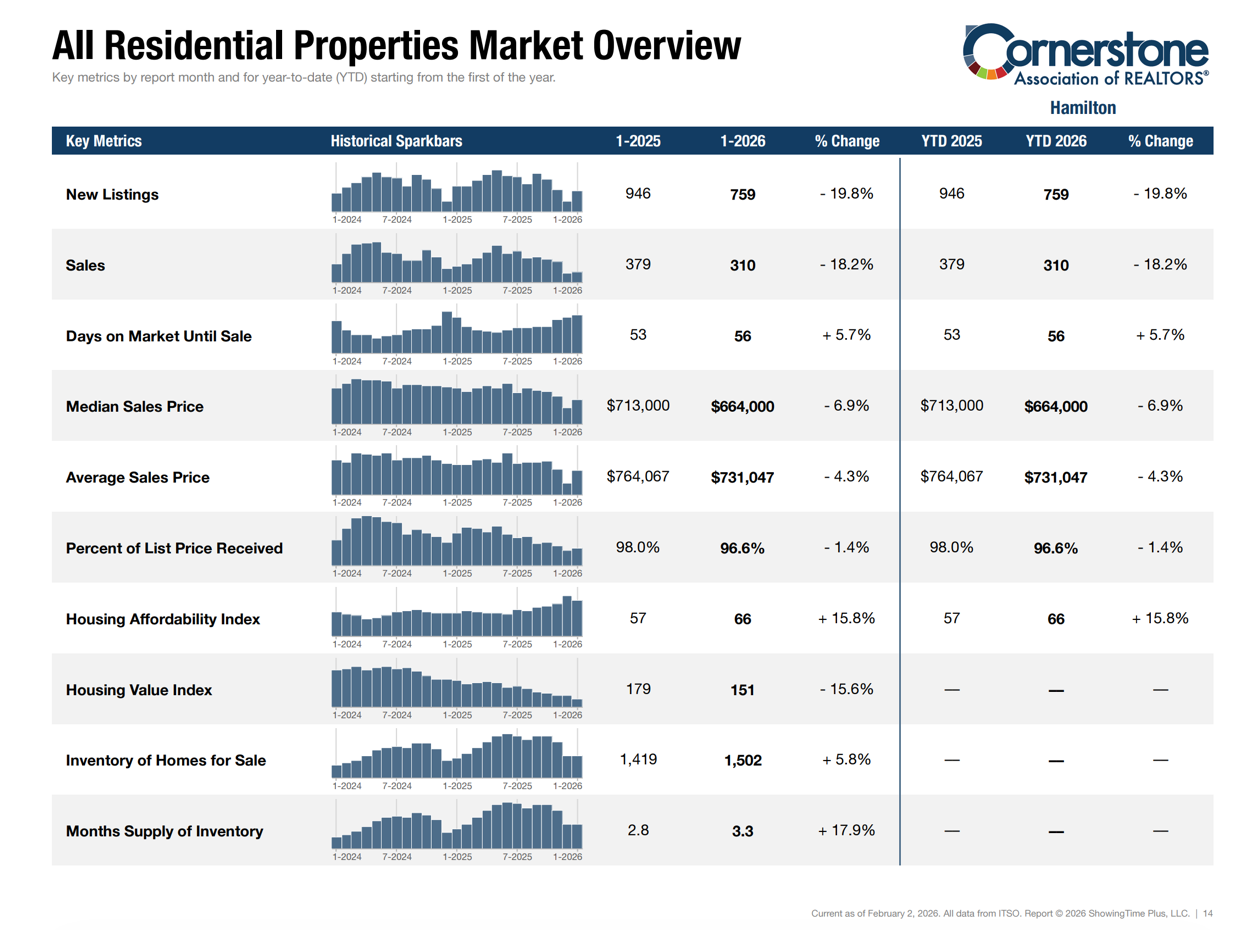
In Hamilton, Cornerstone’s all-residential snapshot shows softer activity and higher supply compared to last January. Hamilton recorded 310 residential sales (↓ 18.2% year-over-year) and 759 new listings (↓ 19.8%). Inventory rose to 1,502 active listings (↑ 5.8%), bringing months of supply to 3.3 (↑ 17.9%). Average days on market increased to 56 days (↑ 5.7%).
Pricing also softened year-over-year:
- Average sale price: $731,047 (↓ 4.3% YoY)
- Median sale price: $664,000 (↓ 6.9% YoY)
- Percent of list price received: 96.6% (down from 98.0%)
What this suggests right now: Hamilton is moving at a more balanced pace than last year, with buyers generally benefiting from more selection and less urgency. For sellers, accurate pricing and strong presentation remain essential, especially as days on market trend higher.
Coming Up: A Closer Look by Housing Segment (Hamilton)
Next, we’ll break down Hamilton’s results by Single Family and Townhouse/Condo segments. This format helps clarify where inventory is building faster, where timelines are lengthening, and how pricing and negotiating conditions can differ depending on the type of home.
Hamilton Market Breakdown by Housing Segment
To get a clearer picture of what’s driving conditions in Hamilton, it helps to separate the market by housing segment. Single family homes and townhouse/condo properties are responding differently to today’s pricing and supply environment—so below, we’ve summarized the key January indicators for each segment and what they may mean for buyers and sellers.
Single Family Homes (Hamilton)
Single family activity slowed from last January, while supply remained relatively steady.
Key single family indicators (January):
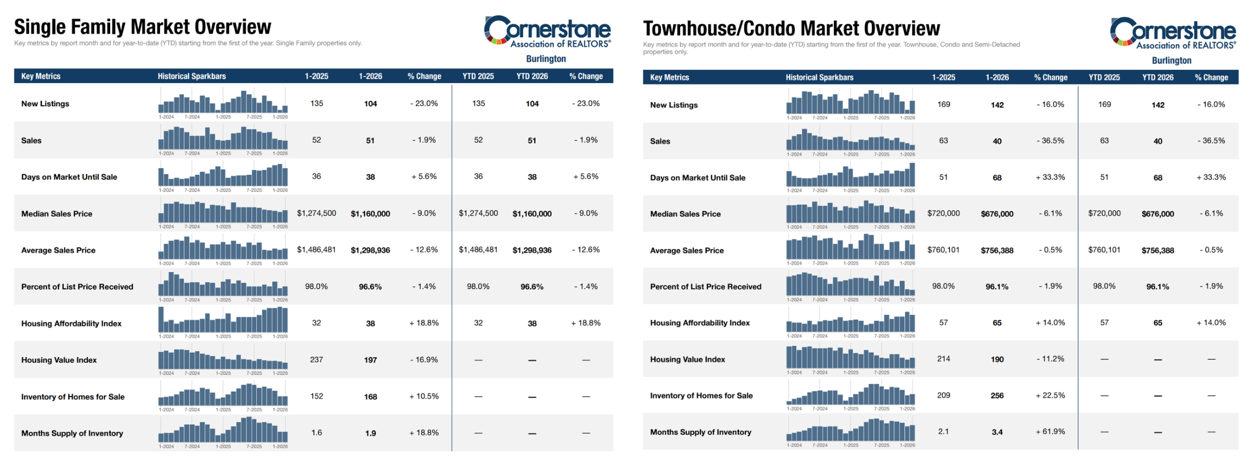
- New listings: 458 (↓ 25.4% YoY)
- Sales: 201 (↓ 18.6% YoY)
- Inventory: 889 (↑ 1.8% YoY)
- Months of supply: 2.8 (↑ 7.7%)
- Days on market: 56 (↑ 5.7%)
- Median price: $705,000 (↓ 10.2%)
- Average price: $808,888 (↓ 4.3%)
- Percent of list price received: 96.4% (↓ 1.8%)
Takeaway: This segment is closer to balanced conditions, but price sensitivity is higher than last year. Homes that are well-positioned and well-presented can still move efficiently, while overpricing can cost time and momentum.
Townhouse/Condo Homes (Hamilton)
The townhouse/condo segment leaned more buyer-friendly in January, with inventory and months of supply rising more sharply.
Key townhouse/condo indicators (January):
- New listings: 301 (↓ 9.3% YoY)
- Sales: 109 (↓ 17.4% YoY)
- Inventory: 613 (↑ 12.3% YoY)
- Months of supply: 4.4 (↑ 41.9%)
- Days on market: 58 (↑ 7.4%)
- Median price: $597,000 (↓ 4.9%)
- Average price: $587,504 (↓ 3.9%)
- Percent of list price received: 96.9% (↓ 0.7%)
Takeaway: With more supply and longer selling timelines, buyers often have more negotiating flexibility in this segment. For sellers, strategy matters—pricing accurately, preparing the home well, and marketing strongly to stand out.
Coming Up: Area-by-Area Breakdown Across Hamilton
Next, we’ll move into an area-by-area breakdown across Hamilton’s key market districts to show where sales activity held firmer, where inventory is building fastest, and how pricing is trending across different parts of the city. This neighbourhood-level view is important because Hamilton doesn’t move as one uniform market—conditions can shift meaningfully from one area to the next depending on housing type, pricing, and buyer demand.
Hamilton District Snapshot: Prices & Sales by Area (January 2026)
To round out Hamilton’s January picture, here’s a district-level snapshot showing how average sale price and sales activity varied across key market areas.
Two standouts this month:
- Hamilton Mountain led the city in sales with 79 transactions, while the average sale price was $696,860 (↓ 3.9% YoY).
- Flamborough posted the highest average sale price at $1,304,375 (↑ 20.3% YoY), with 8 sales—a smaller sample that can contribute to bigger year-over-year swings.
District-level results (January 2026):
- Ancaster Avg: $1,034,500 (↓ 0.8% YoY) | Sales: 33 (0.0% YoY)
- Dundas Avg: $1,207,143 (↑ 35.0% YoY) | Sales: 7 (↓ 58.8% YoY)
- Flamborough Avg: $1,304,375 (↑ 20.3% YoY) | Sales: 8 (↓ 38.5% YoY)
- Glanbrook Avg: $729,882 (↓ 5.3% YoY) | Sales: 17 (↓ 37.0% YoY)
- Hamilton Centre Avg: $506,692 (↓ 6.1% YoY) | Sales: 50 (↑ 8.7% YoY)
- Hamilton East Avg: $563,049 (↑ 3.6% YoY) | Sales: 41 (↑ 5.1% YoY)
- Hamilton Mountain Avg: $696,860 (↓ 3.9% YoY) | Sales: 79 (↓ 13.2% YoY)
- Waterdown Avg: $966,111 (↓ 1.9% YoY) | Sales: 18 (↓ 10.0% YoY)
- Stoney Creek Avg: $802,981 (↓ 1.9% YoY) | Sales: 44 (↓ 36.2% YoY)
- Hamilton West Avg: $585,234 (↓ 14.9% YoY) | Sales: 23 (↓ 8.0% YoY)
What this suggests right now: Pricing and pace are still highly neighbourhood-specific. If you’re making a move in 2026, district-level context matters as much as the city-wide averages.
Coming Up: Market Summary & What It Means for You
Next, we’ll translate January’s numbers into practical takeaways for buyers, sellers, and investors—what they suggest about leverage, pricing, and timing—then share how to connect with Judy Marsales Real Estate Brokerage for neighbourhood-level guidance..
Summary & Expert Insights: Hamilton & Burlington Real Estate Market (January 2026)
January opened with a measured pace across the Hamilton-Burlington market area, with softer year-over-year sales alongside a seasonal rebound in new listings. Cornerstone reported 779 total home sales across its MLS® System (↓ 21.9% YoY) and 2,173 new listings, while inventory remained elevated, keeping conditions more choice-driven for buyers. Days on market reached 54, reinforcing a slower, more balanced pace than last year.
In the Hamilton-Burlington market area, activity was steady month-over-month with 470 sales (↑ 1.5% MoM) and 1,203 new listings (↑ 119.9% MoM). Months of supply was 3.2, and the MLS® HPI was unchanged month-over-month (↓ 10.0% YoY), suggesting pricing may be stabilizing after the larger adjustments of the past year.
Within Hamilton, the market recorded 310 sales (↓ 18.2% YoY) and 759 new listings (↓ 19.8% YoY), with 1,502 active listings and 3.3 months of supply. The average sale price was $731,047 and the median sale price was $664,000. Segment trends also remained split: single family conditions were closer to balanced (2.8 months of supply) while townhouse/condo leaned more buyer-friendly (4.4 months).
“As homes stay on the market longer and interest rates stabilize, opportunities for buyers continue to improve,” says Bill Duce, CEO of Cornerstone.
What This Means for You
- Buyers: More inventory and longer selling timelines mean more opportunity to compare options, negotiate, and include the right protections—especially in higher-supply segments.
- Sellers: Success is still very achievable, but strategy matters. Accurate pricing, strong presentation, and confident marketing are key as buyers become more selective.
- Investors: Higher supply and softer pricing in select segments may create opportunities where negotiation leverage is stronger.
Ready to Buy or Sell? Work With Judy Marsales Real Estate Brokerage
Whether you're planning a purchase, preparing to list, or considering an investment, Judy Marsales Real Estate Brokerage offers the local expertise and trusted guidance you need in today’s market. With 38 years of experience serving our community, our brokerage delivers personalized service and results-driven strategy across Hamilton, Dundas, Ancaster, Burlington, and beyond.
Why Work With Us
- Personalized Guidance for first-time buyers, move-up purchasers, downsizers, and long-time homeowners
- Neighbourhood Expertise grounded in district-by-district insight and current pricing trends
- Up-to-Date Market Knowledge so you can act confidently when the right opportunity appears
Stay Connected
Follow us on Facebook and Instagram for monthly market updates, new listings, open houses, and local community highlights.
Get in Touch
Locke Street South: locke@judymarsales.com | 905-529-3300
Westdale: westdale@judymarsales.com | 905-522-3300
Curious what your home could sell for in today’s market? Use our Home Value Calculator for a quick estimate, or reach out for a more detailed, neighbourhood-specific evaluation. For broader context, you can also review Cornerstone’s January 2026 market statistics.
Make your next move with clarity and confidence — choose Judy Marsales Real Estate Brokerage for trusted local guidance.
January 14, 2026
Erin
Local Hamilton Market Statistics General Real Estate Advice Real Estate Trends

Hamilton Real Estate Market Update – December 2025
The Cornerstone Association of REALTORS® (Cornerstone) has released its December 2025 real estate statistics, showing a year-end market shaped by slower sales and more choice for buyers across Hamilton, Burlington, Haldimand County, and Niagara North. The region closed 2025 with 8,996 total sales, a 12 per cent annual decline, marking the slowest year since 2010 and more than 30 per cent below long-term averages.
This Hamilton real estate market update for December 2025 will highlight:
- Key market shifts that defined the year-end slowdown
- How sales, new listings, and inventory finished 2025 and what that signals for early 2026
- Pricing trends across property types and what they mean for buyers and sellers
According to Cornerstone spokesperson Nicolas von Bredow, fewer new listings entered the market late in the year, while slower sales meant more homes stayed active, giving buyers more options and time to make decisions. He notes 2025 was influenced by broader economic uncertainty, with many buyers remaining cautious due to job-security concerns and higher interest rates.
Looking ahead, von Bredow says the market could see more balanced conditions in 2026 if borrowing costs continue to ease and new government incentives support affordability. He adds that announced tax relief on eligible new homes for first-time buyers could help stimulate demand, while Cornerstone continues to advocate for broader measures to increase impact.
Market conditions in 2025 also weighed on pricing, with an annual decline reported across property types, particularly for row and apartment-style homes. Benchmark prices fell across all areas in the region, with the largest declines in Burlington and smaller declines in Haldimand County.
The statistics in this report are sourced from the ITSO MLS® System and reflect broader market patterns across the region.
Coming Up: Key Highlights From December’s Market Performance
Next, we’ll break down December’s stand-out numbers and what they reveal about year-end conditions in Hamilton covering sales pace, inventory levels, pricing trends, and how today’s market is setting the tone for early 2026.
Hamilton Residential Real Estate: Price, Sales & Market Conditions
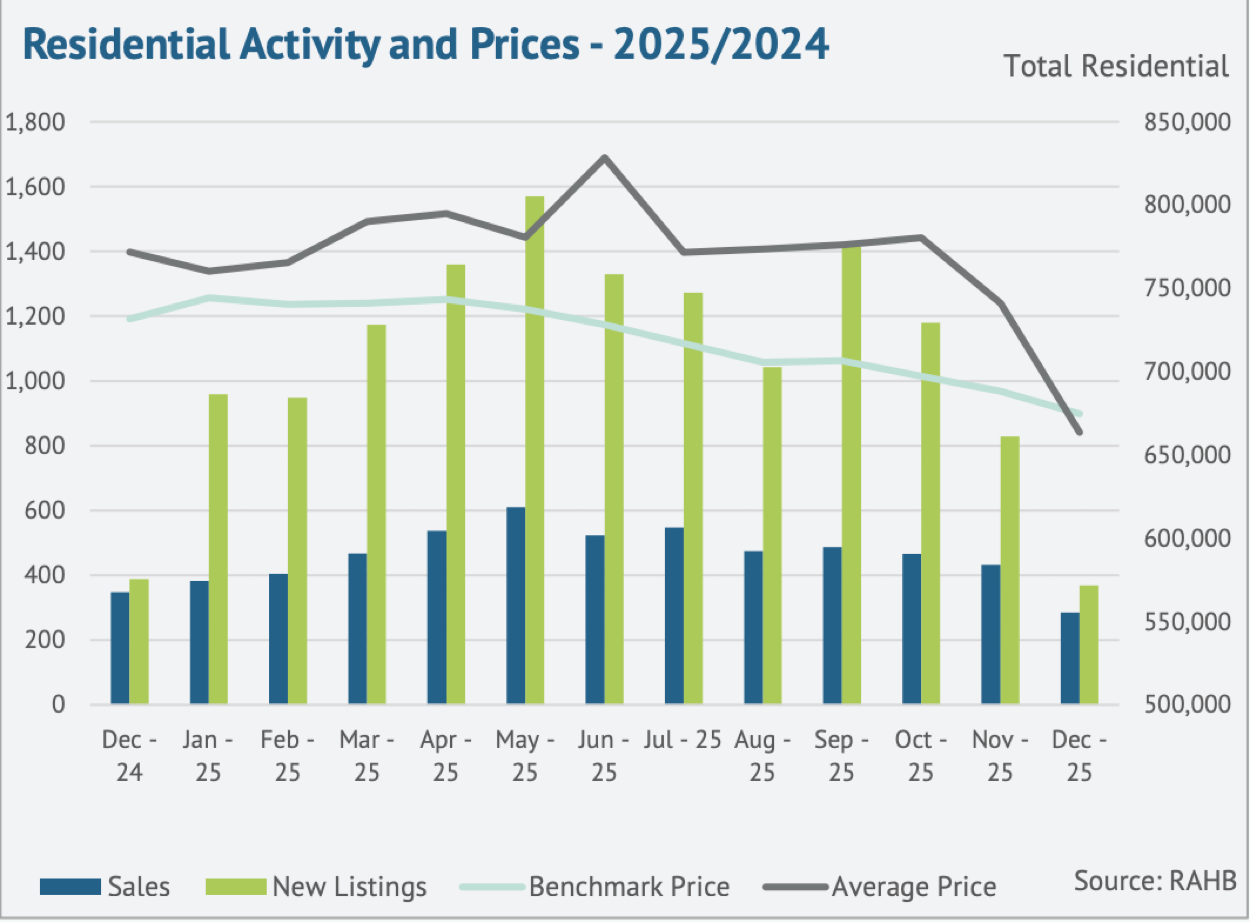
Hamilton’s residential market ended 2025 on a quieter note. December recorded 285 sales, down 18.1 per cent year-over-year. For the year, Hamilton saw 5,615 sales, a nine per cent decline, marking the lowest annual total since 2010 and more than 30 per cent below typical levels. With demand softer and supply elevated, buyers continued to benefit from more choice and less urgency, while sellers faced a more competitive environment.
Inventory and Listing Activity
New listing activity eased seasonally in December, but inventory remained higher than last year, keeping conditions balanced-to-buyer-leaning.
Key listing and inventory indicators:
- New listings: 368, down 5.2% year-over-year
- Inventory: 1,611 active listings, up 13.7% year-over-year
- Months of supply: 5.7 months, up 38.8% year-over-year
With sales slowing faster than new supply, months of supply have remained above five months since September, reinforcing a market where buyers can take a measured approach.
Pricing Trends and Buyer Conditions
The December residential average price was $663,558, down 14.0% year-over-year. Average days on market (DOM) came in at 54.2 days, down 11.0% year-over-year, indicating that well-priced, well-presented homes can still attract attention.
On an annual basis, the average benchmark price for 2025 was $718,708, about five per cent lower than 2024. Benchmark declines were most pronounced in apartment-style homes (down over eight per cent), while detached, semi-detached, and row homes each declined just under five per cent, a reminder that conditions vary significantly by property type.
Looking Ahead: Property Type Breakdown
Next, we’ll break down December’s results by detached, semi-detached, row, and apartment-style homes to highlight where demand held firmer and where pricing adjustments were most noticeable heading into early 2026.
Hamilton Real Estate: Breakdown by Property Type – December 2025
December showed mixed performance across Hamilton’s major property types. Detached homes remained the most active segment, while row and semi-detached properties recorded the sharpest sales slowdowns. Across the board, elevated inventory and softer demand continued to influence pricing, keeping conditions more favourable for buyers than we’ve seen in recent years.
Below is a closer look at how each property type performed in December and where the most notable shifts occurred.
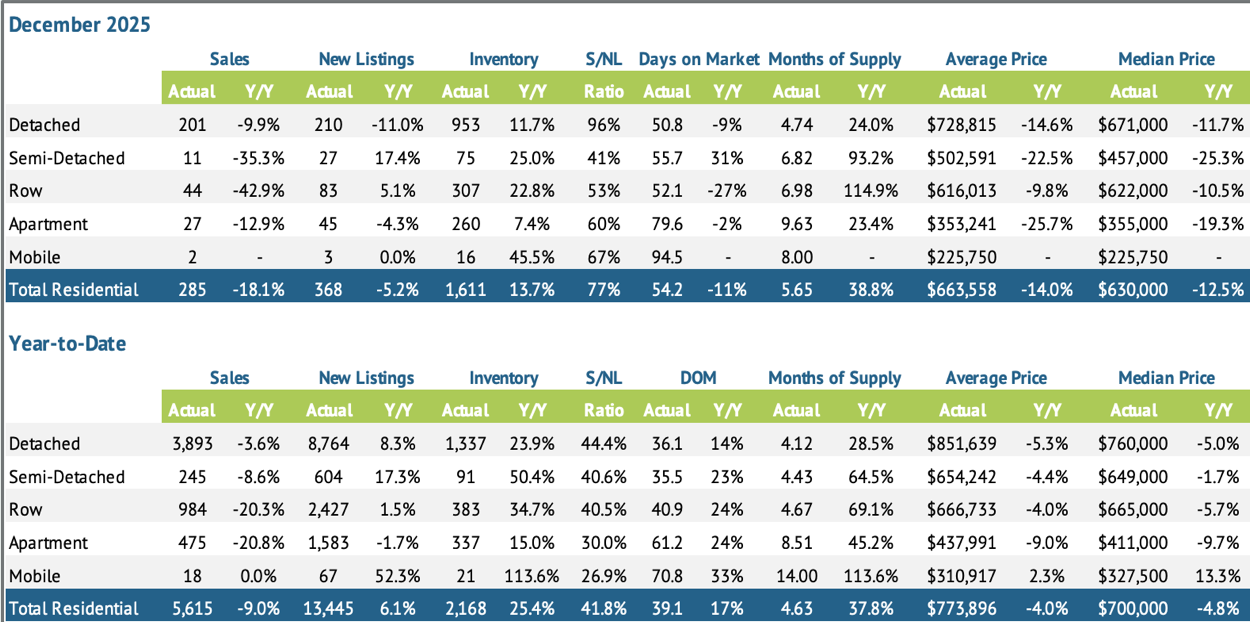
Detached Homes
- Sales: 201 (↓ 9.9% YoY)
- New Listings: 210 (↓ 11.0%)
- Inventory: 953 (↑ 11.7%)
- Average Price: $728,815 (↓ 14.6%)
- Median Price: $671,000 (↓ 11.7%)
Detached homes continued to lead the market in activity, but sales eased compared to last December. With inventory still rising, buyers have more selection and negotiating room, while sellers are finding that strategic pricing and strong presentation matter more than ever.
Semi-Detached Homes
- Sales: 11 (↓ 35.3% YoY)
- New Listings: 27 (↑ 17.4%)
- Inventory: 75 (↑ 25.0%)
- Average Price: $502,591 (↓ 22.5%)
- Median Price: $457,000 (↓ 25.3%)
Semi-detached homes saw a sharper pullback in sales alongside a rise in both new listings and inventory. This segment remains firmly buyer-leaning, with price sensitivity playing a larger role and fewer purchasers moving quickly.
Row (Townhomes)
- Sales: 44 (↓ 42.9% YoY)
- New Listings: 83 (↑ 5.1%)
- Inventory: 307 (↑ 22.8%)
- Average Price: $616,013 (↓ 9.8%)
- Median Price: $622,000 (↓ 10.5%)
Townhomes recorded one of the steepest slowdowns in sales, while supply continued to build. The result is a more competitive landscape for sellers and greater flexibility for buyers—particularly around pricing and terms.
Apartments & Condos
- Sales: 27 (↓ 12.9% YoY)
- New Listings: 45 (↓ 4.3%)
- Inventory: 260 (↑ 7.4%)
- Average Price: $353,241 (↓ 25.7%)
- Median Price: $355,000 (↓ 19.3%)
Apartments and condos continued to face the most pronounced price softness, even with a smaller decline in sales than some other segments. Higher relative supply and affordability-conscious buyers are keeping pressure on this category, making pricing strategy especially important.
Coming Up: Regional Summary – December 2025
Next, we’ll move into a neighbourhood-level breakdown across Hamilton’s key districts (including areas such as Hamilton Mountain, Hamilton West, and Ancaster) to highlight where sales activity held firmer, where pricing adjusted most, and where more balanced conditions may be emerging as we head into early 2026.
Regional Summary – December 2025
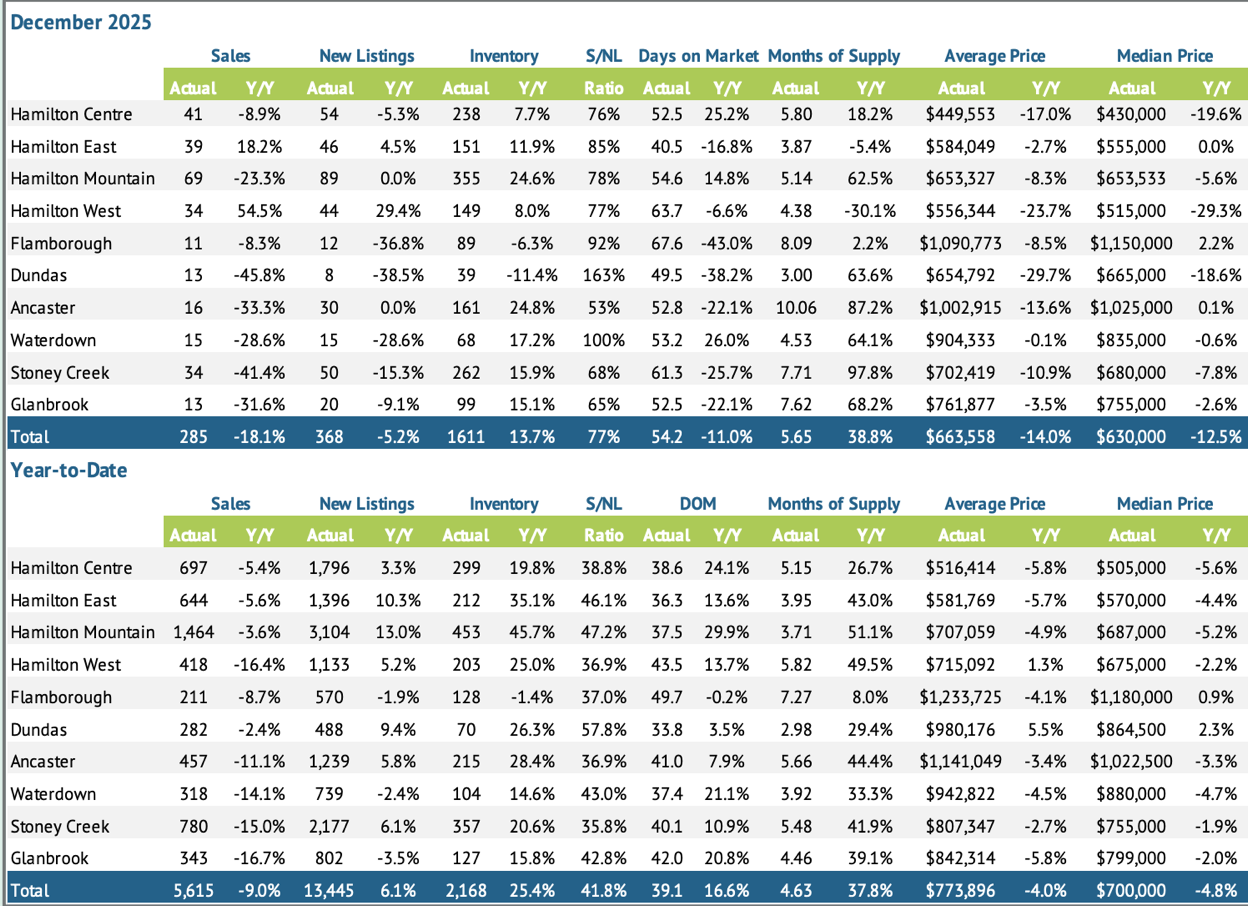
Hamilton’s housing market showed clear variation across districts in December, with a few stand-out trends shaping the month. Hamilton Mountain led the city in sales volume (69 sales), while Hamilton West and Hamilton East were the only two districts to post year-over-year sales gains. At the same time, inventory increased in most areas, and every district recorded a year-over-year decline in average price, reinforcing the broader year-end theme of softer pricing in a higher-supply environment.
Key District Highlights
Hamilton Mountain – Highest Sales Volume (and rising supply)
- Sales: 69 (↓ 23.3% YoY)
- Inventory: 355 (↑ 24.6%) | Months of supply: 5.14 (↑ 62.5%)
- Average price: $653,327 (↓ 8.3%)
Hamilton Mountain remained the city’s busiest district, but higher inventory and rising supply helped keep conditions more measured.
Hamilton West – Strongest sales gain (but softer pricing)
- Sales: 34 (↑ 54.5% YoY)
- New listings: 44 (↑ 29.4%)
- Average price: $556,344 (↓ 23.7%)
Sales improved in Hamilton West, but pricing remained under pressure—suggesting buyers still held meaningful leverage.
Hamilton East – Sales growth with comparatively tighter supply
- Sales: 39 (↑ 18.2% YoY)
- Months of supply: 3.87 (↓ 5.4%)
- Average price: $584,049 (↓ 2.7%) | Median price: $555,000 (0.0%)
Hamilton East stood out for steadier pricing and one of the tightest supply positions in the city.
Supply didn’t rise everywhere: Flamborough and Dundas
- Flamborough inventory: 89 (↓ 6.3%) | New listings: 12 (↓ 36.8%)
- Dundas inventory: 39 (↓ 11.4%) | New listings: 8 (↓ 38.5%)
These were the only two districts where inventory fell year-over-year, largely tied to a sharp pullback in new listing activity.
Most buyer-leaning supply: Ancaster
- Months of supply: 10.06 (↑ 87.2%)
- Average price: $1,002,915 (↓ 13.6%)
Ancaster continued to show the most supply-heavy conditions, offering buyers significant choice heading into the new year.
2025 Year-to-Date Snapshot for Hamilton
Looking at the full year, the year-to-date figures capture the bigger story of 2025: sales slowed, new listings increased, and inventory built, creating more balanced conditions overall.
Total Residential (Year-to-Date):
- Sales: 5,615 (↓ 9.0% YoY)
- New listings: 13,445 (↑ 6.1%)
- Inventory: 2,168 (↑ 25.4%) | Months of supply: 4.63 (↑ 37.8%)
- Average price: $773,896 (↓ 4.0%) | Median price: $700,000 (↓ 4.8%)
Overall, these year-to-date results reinforce a market that became more balanced through 2025, with higher supply giving buyers more breathing room. For sellers, the takeaway is clear: pricing strategy and neighbourhood-level insight matter more than ever.
Looking Ahead: Average Residential Price by District
Next, we’ll break down average residential prices by district to show where values held firmer, where year-end softness was most noticeable, and how different neighbourhoods are positioned heading into early 2026.
Average Residential Prices by District – December 2025
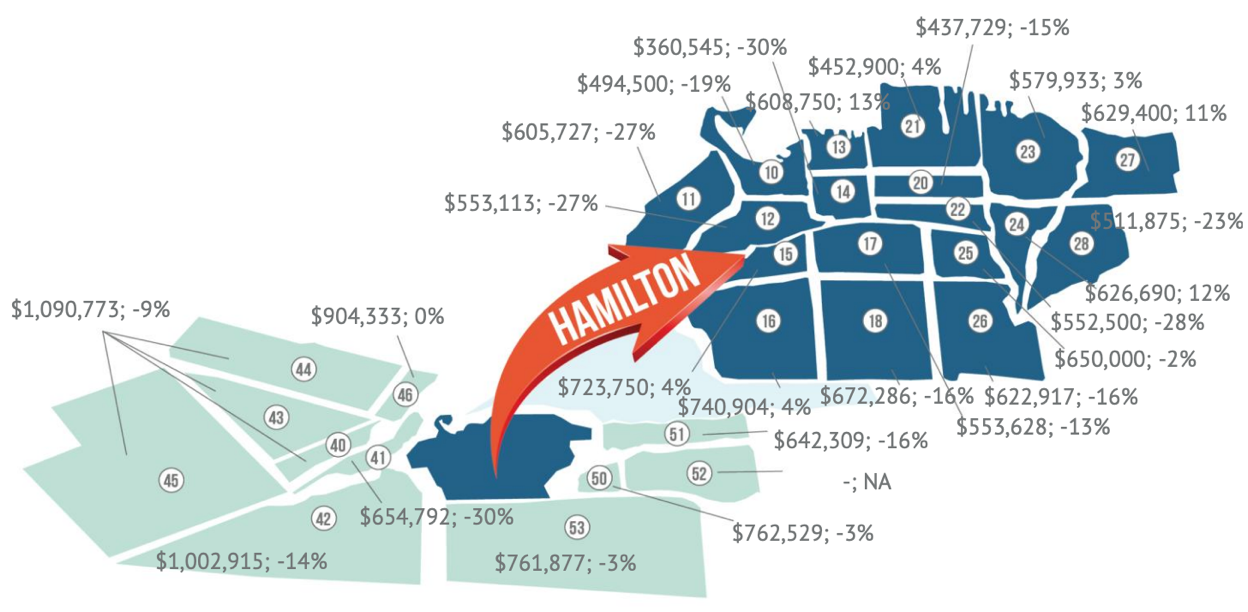
Average sale prices continued to show meaningful variation across Hamilton in December, reinforcing a market where neighbourhood-level performance can differ significantly from broader city-wide trends. This month, we’re focusing on Hamilton West, Hamilton East, and Dundas, three areas that highlight just how important micro-market pricing can be as 2025 wraps up.
Hamilton West – Sub-Area Breakdown (Areas 10, 11, 12)
Hamilton West saw consistent year-over-year softening across its key sub-areas, pointing to a more price-sensitive environment.
- Area 10: $494,500 (↓ 19%)
- Area 11: $605,727 (↓ 27%)
- Area 12: $553,113 (↓ 27%)
Standout Insight: With all three pockets trending lower year-over-year—especially Areas 11 and 12—pricing accuracy and strong presentation remain essential to attract qualified buyers.
Hamilton East – Sub-Area Breakdown (Areas 23, 24, 27, 28)
Hamilton East showed a mix of resilience and adjustment, with several sub-areas posting gains even as one recorded a sharper pullback.
- Area 23: $579,933 (↑ 3%)
- Area 24: $626,690 (↑ 12%)
- Area 27: $629,400 (↑ 11%)
- Area 28: $511,875 (↓ 23%)
Standout Insight: Areas 24 and 27 delivered the strongest growth within this group, while Area 28’s decline highlights how outcomes can vary sharply block-to-block depending on property mix, condition, and buyer demand.
Dundas – Sub-Area Snapshot (Area 41)
Dundas saw a notable year-over-year adjustment in December.
- Area 41: $654,792 (↓ 30%)
Standout Insight: This shift underscores the importance of hyper-local comparables in Dundas right now, as pricing can swing meaningfully depending on the specific segment and type of home coming to market.
What This Means for Buyers and Sellers
December’s pricing map reinforces a key takeaway: Hamilton is not moving as one uniform market. For buyers, that creates opportunities to compare sub-areas and negotiate based on very local conditions. For sellers, it highlights the value of district-specific pricing strategy and guidance grounded in neighbourhood-level data.
Next, we’ll summarize the month’s key statistics and share expert insights to help put these trends into context as we head into 2026.
Summary & Expert Insights: Hamilton Real Estate Market
December closed with 285 residential sales in Hamilton, reflecting a typical year-end slowdown alongside softer demand conditions that shaped much of 2025. New listing activity slowed to 368, while active inventory rose to 1,611 homes, keeping conditions balanced-to-buyer-leaning and giving purchasers more options and negotiating room. Hamilton’s average residential sale price was $663,558 and the median price was $630,000, reinforcing the price adjustments seen across many districts as supply remained elevated.
Across the broader Cornerstone region (Hamilton, Burlington, Haldimand County, and Niagara North), 2025 ended with 8,996 total sales, down 12 per cent for the year—marking the slowest annual total since 2010 and more than 30 per cent below long-term averages.
“At the end of 2025, fewer new listings came online, and with more homes staying on the market because of slower sales, buyers had more options,” says Nicolas von Bredow, Cornerstone spokesperson for the Hamilton-Burlington market area. He notes that 2025 was influenced by global uncertainty and economic concerns, with many buyers remaining cautious due to job security and higher interest rates.
What This Means for You
- Buyers: More choice and steadier conditions in many neighbourhoods mean more time to compare options and negotiate confidently.
- Sellers: Strategic pricing and strong presentation remain essential as buyers become more selective.
- Investors: Softer pricing in select segments and districts may create opportunities, particularly where supply is higher.
Moving Forward
As the market continues to adjust, the guidance of an experienced, community-focused REALTOR is essential. Judy Marsales Real Estate Brokerage is here to help you make informed decisions—whether you’re buying, selling, or planning your next move.
Ready to Buy or Sell in Hamilton? Work With a Local Expert Brokerage
Whether you're preparing to list your home, searching for the right property, or considering an investment, Judy Marsales Real Estate Brokerage offers the local expertise and trusted guidance you need in today’s Hamilton market. With more than 38 years of experience serving our community, our team is committed to personalized service and results-driven strategy.
Why Work With Us
- Personalized Guidance: Support for first-time buyers, move-up purchasers, downsizers, and long-time homeowners.
- Hamilton Neighbourhood Expertise: Insight into pricing trends, inventory levels, and district-by-district market conditions.
- Up-to-Date Listings & Market Knowledge: Stay connected to new opportunities across Hamilton, Ancaster, and Dundas.
Stay Connected
Follow us on Facebook and Instagram for:
- Monthly Hamilton market updates
- New listings and open houses
- Local stories and community insights
Get in Touch
Locke Street South: locke@judymarsales.com | 905-529-3300
Westdale: westdale@judymarsales.com | 905-522-3300
Curious what your home could sell for in today’s market? Use our Home Value Calculator for a quick estimate, or reach out for a more detailed, neighbourhood-specific evaluation. For broader context, you can also review Cornerstone’s December 2025 market statistics.
Make your next move with clarity and confidence — choose Judy Marsales Real Estate Brokerage for trusted Hamilton real estate guidance.
December 11, 2025
Erin
Local Hamilton Market Statistics General Real Estate Advice Real Estate Trends

Hamilton Real Estate Market Update – November 2025
The Cornerstone Association of REALTORS® (Cornerstone) has released its November 2025 real estate statistics, revealing a market continuing to rebalance as winter approaches. A total of 624 homes sold across Hamilton, Burlington, Haldimand County, and Niagara North—reflecting the typical seasonal slowdown and contributing to a 12 per cent year-to-date decline in overall sales activity. While demand has eased, market conditions remain stable, with buyers benefiting from improved selection and more time to make decisions.
This Hamilton real estate market update for November 2025 will highlight:
- Stand-out market shifts that shaped November’s performance.
- How sales, new listings, and inventory levels evolved as winter nears.
- Pricing trends and what they mean for buyers and sellers navigating today’s market.
According to Cornerstone spokesperson Nicolas von Bredow, the region is experiencing a more balanced environment after years of intense competition. “Although sales and new listings are down, this is typical as we enter the winter months. We have inventory that is still higher than long-term trends, creating opportunities for those who have been waiting on the sidelines,” he explains. Homes are also taking longer to sell, giving buyers greater negotiating room and reducing the pressure of bidding-war conditions.
Sellers, meanwhile, continue to adjust their expectations from the peak prices of 2022. Well-priced homes are still attracting interest, but elevated supply remains a defining factor. New listings eased compared to last year, bringing the sales-to-new-listings ratio to 50 per cent. Inventory levels, although down slightly from October, are still higher than last year and 68 per cent above long-term trends, reinforcing balanced conditions across the region.
Year-to-date, the average unadjusted benchmark price sits at $775,464, nearly five per cent lower than 2024. Pricing stability continues to vary by district and property type—making local expertise essential when interpreting today’s market signals.
The statistics in this report are sourced from the ITSO MLS® System and reflect broader market patterns across the region.
Coming Up: Key Highlights From November’s Market Performance
Next, we’ll identify the month’s stand-out metrics and explore the factors shaping buyer and seller behaviour heading into the winter season.
Hamilton Residential Real Estate: Price, Sales & Market Conditions
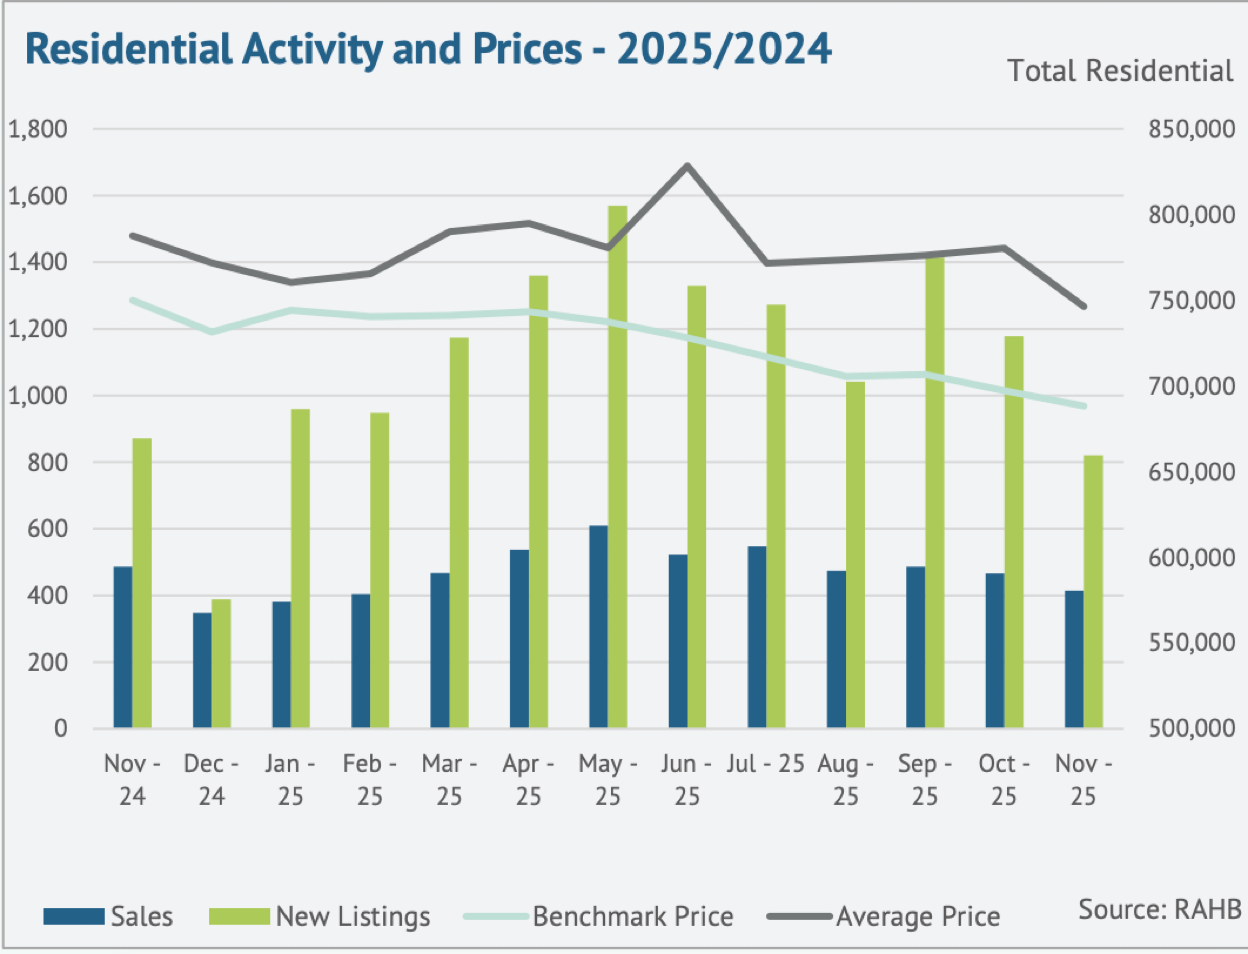
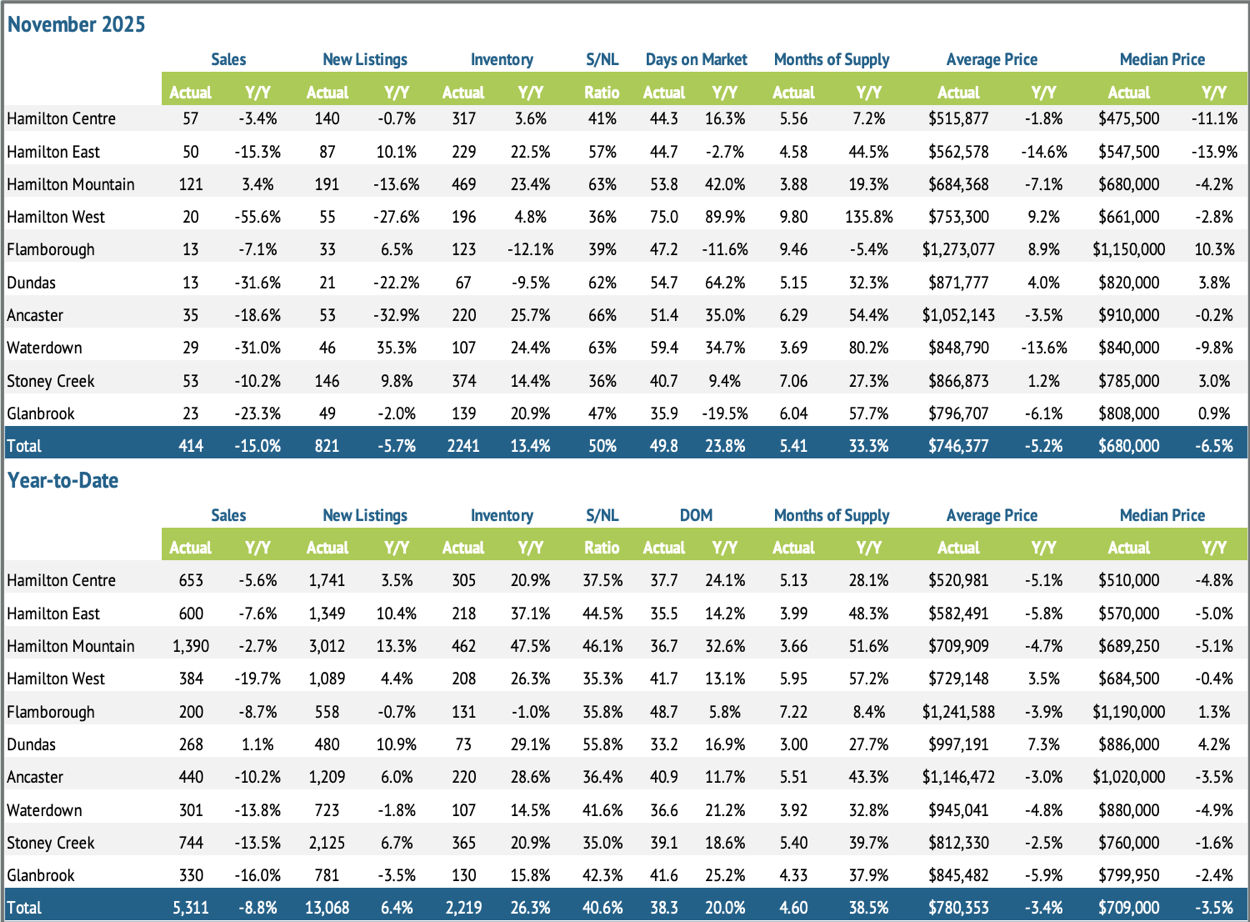
Hamilton’s residential real estate market saw another slowdown in November, with 414 sales, marking a 15 per cent decline year-over-year and one of the lowest November totals in more than a decade. Demand continues to be tempered by affordability challenges, higher borrowing costs, and broader economic uncertainty, contributing to a nine per cent year-to-date decline in overall sales. The average residential price across Hamilton reached $746,377, down 5.2 per cent year-over-year, reflecting a market that is adjusting to elevated inventory and more cautious buyer behaviour.
As seen throughout the fall, quieter conditions are giving buyers more time to make decisions, negotiate, and evaluate options, while sellers continue to recalibrate pricing expectations to align with shifting market trends.
Inventory and Listing Activity
November saw a continued easing in new listings, contributing to a modest pullback in overall supply. Even so, inventory remains elevated compared to last year and well above long-term trends.
Key listing and inventory indicators:
- New listings: 821 units, down 5.7% year-over-year.
- Sales-to-new listings ratio: 50%, representing regional balance and similar buyer-leaning trends within Hamilton.
- Inventory: 2,241 active listings, up 13.4% year-over-year.
- Months of supply: 5.4 months, a 33.3% increase from last year.
While new listing activity has eased, the pullback in demand is the primary factor holding inventory levels high. Oversupply remains most noticeable in higher-density segments such as apartment-style units, where price adjustments continue to be more substantial.
Market conditions vary across neighbourhoods, with several areas showing steadier absorption, while others are experiencing slower turnover heading into winter.
Pricing Trends and Buyer Conditions
The unadjusted benchmark price for November settled at $688,300, an 8 per cent decline year-over-year and nearly 5 per cent lower year-to-date. Price softness continues across property types, with the largest declines occurring in apartment-style homes. Detached and semi-detached properties remain more resilient but are still adjusting to elevated supply and slower sales activity.
Additional pricing insights:
- Prices declined across all major property types, reflecting reduced competition and increased negotiation room.
- Apartment-style units recorded the most significant annual price drops.
- Days on market increased to 49.8 days (up 23.8% year-over-year), highlighting longer decision timelines and more selective buyer behaviour.
Overall, November’s pricing trends reinforce a market where buyers hold more leverage, while sellers must remain strategic with pricing and presentation to attract qualified purchasers.
Looking Ahead: Property Type Breakdown
This overview sets the stage for a more detailed examination of how detached, semi-detached, townhome, and apartment-style properties performed in November. Understanding these differences will help clarify where opportunities may be emerging for both buyers and sellers as we move through the winter market.
Hamilton Real Estate: Breakdown by Property Type: November 2025

November showed varying performance across Hamilton’s major property types, with detached homes remaining the most active segment and higher-density housing seeing the sharpest slowdowns. Elevated inventory and softer demand continued to influence pricing and buyer conditions across the board.
Below, we take a closer look at how each property type performed and where the most notable shifts occurred this month.
Detached Homes
- Sales: 305 (↓ 1.3% YoY)
- New Listings: 567 (↑ 1.4%)
- Inventory: 1,368 (↑ 12%)
- Average Price: $818,353 (↓ 7.1%)
- Benchmark Price: $769,200 (↓ 8%)
Detached homes remained steady, with sales holding close to last year’s levels. Rising inventory is contributing to ongoing price adjustments, giving buyers more negotiating power and longer decision windows.
Semi-Detached Homes
- Sales: 15 (↓ 34.8% YoY)
- New Listings: 36 (↓ 2.7%)
- Inventory: 102 (↑ 27.5%)
- Average Price: $501,927 (↓ 24.6%)
- Benchmark Price: $681,700 (↓ 7%)
Semi-detached activity slowed sharply, with higher inventory and fewer sales putting clear downward pressure on prices. Buyer conditions remained favourable as demand eased.
Row (Townhomes)
- Sales: 63 (↓ 37.6% YoY)
- New Listings: 138 (↓ 17.4%)
- Inventory: 408 (↑ 21.1%)
- Average Price: $632,903 (↓ 8.9%)
- Benchmark Price: $585,900 (↓ 8%)
Townhomes saw significant declines in both sales and pricing. Elevated supply combined with moderating demand continued to create competitive conditions for sellers.
Apartments & Condos
- Sales: 31 (↓ 41.5% YoY)
- New Listings: 77 (↓ 23.8%)
- Inventory: 338 (↑ 3.7%)
- Average Price: $387,113 (↓ 20.5%)
- Benchmark Price: $393,700 (↓ 12%)
Apartments recorded the steepest pullback, with sales and prices falling more than any other segment. Softer demand and higher relative supply continue to weigh on this category.
Coming Up: Regional Summary – November 2025
Next, we’ll move into a detailed regional breakdown across Hamilton’s key districts for November—Hamilton Mountain, Hamilton West, and Ancaster. This overview will highlight how prices, sales activity, and market conditions are evolving at the neighbourhood level, revealing where demand is holding steady, where softness persists, and where balanced conditions are emerging as we head toward the end of 2025.
Regional Summary: November 2025
Hamilton’s housing market continued to show notable variation across districts in November, with several stand-out trends shaping overall performance. Hamilton Mountain once again led the city in total sales, reinforcing its position as Hamilton’s highest-volume and most active residential area. At the opposite end of the spectrum, Hamilton West experienced the steepest sales decline, recording the sharpest drop in year-over-year activity among all districts. Meanwhile, Ancaster reported the largest increase in inventory, underscoring the continued buildup of supply in Hamilton’s upper-end suburban markets.
Price trends also varied widely across the city. While many districts saw year-over-year declines, several areas reported notable price growth, including Hamilton West, Flamborough, Dundas, and Stoney Creek—all posting average price increases despite softer sales activity. These gains highlight ongoing demand for specific neighbourhoods and property types, even as broader market conditions remain balanced to buyer-leaning.
Key District Highlights
To better understand how market conditions varied across the city this month, here are the standout district-level shifts that had the greatest impact on Hamilton’s housing landscape. These highlights showcase where demand strengthened, where supply increased, and which neighbourhoods demonstrated unexpected resilience in pricing.
Hamilton Mountain – Highest Sales Volume
- 121 sales (+3.4% YoY), the most of any district in November.
- Hamilton Mountain continues to anchor Hamilton’s residential market, with steady demand and strong turnover contributing to consistently high sales activity.
Hamilton West – Steepest Sales Decline
- 20 sales (↓ 55.6% YoY), the largest year-over-year drop city-wide.
- This significant slowdown reflects shifting demand dynamics in a district that typically sees varied activity tied to student housing, investment properties, and character neighbourhoods.
Ancaster – Largest Inventory Increase
- 220 active listings (+25.7% YoY), the biggest inventory jump of any district.
- The rise in supply is contributing to more balanced conditions in this higher-end market, offering buyers greater choice heading into winter.
Districts with Price Growth
Despite broader market softness, several districts posted year-over-year average price increases:
- Hamilton West: $753,300 (+9.2%)
- Flamborough: $1,273,077 (+8.9%)
- Dundas: $871,777 (+4.0%)
- Stoney Creek: $866,873 (+1.2%)
These price gains highlight the resilience of upper-tier and lifestyle-oriented neighbourhoods, where unique housing stock and strong community appeal continue to support values.
Looking Ahead: Average Residential Price by District
Next, we’ll break down average residential prices across Hamilton Mountain, Hamilton West, Ancaster, and Stoney Creek, offering a closer look at how pricing is shifting within Hamilton’s most active and supply-sensitive areas as we move toward year-end.
Average Residential Prices by District: November 2025
Average sale prices continued to show meaningful variation across Hamilton’s districts in November, reflecting a market where some neighbourhoods are seeing renewed strength while others continue to adjust to softer demand and elevated supply. This month, we’re focusing on Hamilton Mountain, Hamilton West, Stoney Creek, and Ancaster/Flamborough—districts that stood out for their activity levels, pricing shifts, and contrasting sub-area performance.
Understanding these micro-level differences helps buyers and sellers identify emerging opportunities and better navigate the closing months of 2025.
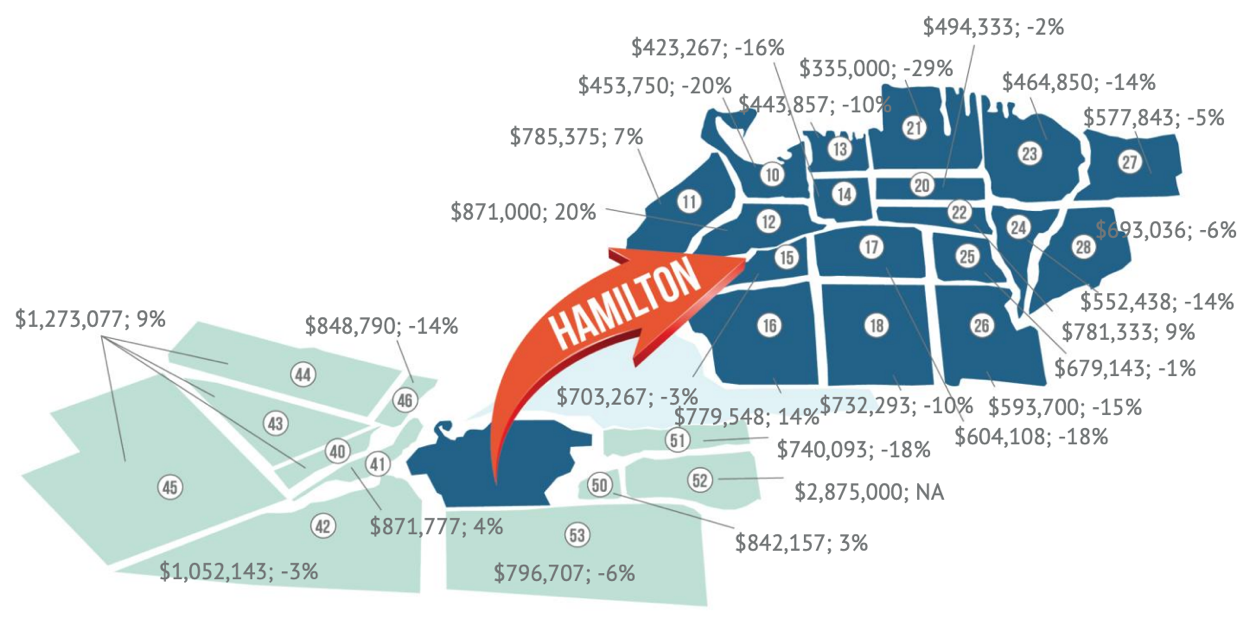
Hamilton Mountain – Sub-Area Breakdown
Hamilton Mountain (Areas 15, 16, 17, 18, 25, 26) remained Hamilton’s strongest district by sales volume. Price movement varied widely across sub-areas, underscoring the diversity of housing stock and buyer demand on the Mountain.
- Area 15: $703,267 (↓ 3%)
- Area 16: $779,548 (↑ 14%)
- Area 17: $604,108 (↓ 18%)
- Area 18: $732,293 (↓ 10%)
- Area 25: $679,143 (↓ 1%)
- Area 26: $593,700 (↓ 15%)
Standout Insight: Area 16 posted the strongest growth on the Mountain with a 14% increase, while Areas 17 and 26 saw notable declines, highlighting how pricing conditions can vary dramatically even within the city’s most active district.
Hamilton West – Sub-Area Breakdown
Hamilton West (Areas 10, 11, 12) recorded one of the most mixed price performances this month, ranging from a steep decline to some of the largest gains city-wide.
- Area 10: $453,750 (↓ 20%)
- Area 11: $785,375 (↑ 7%)
- Area 12: $871,000 (↑ 20%)
Standout Insight: Area 12 recorded a strong 20% increase, one of the highest across the city for November, even as overall sales in Hamilton West declined sharply.
Stoney Creek – Sub-Area Breakdown
Stoney Creek (Areas 50, 51, 52) saw a combination of stability, decline, and an outlier high-value sale affecting average pricing.
- Area 50: $842,157 (↑ 3%)
- Area 51: $740,093 (↓ 18%)
- Area 52: $2,875,000 (N/A)
Standout Insight: Area 50 continues to show modest growth despite elevated supply levels in Stoney Creek, while Area 52 recorded an exceptionally high sale price, increasing the average but not comparable year-over-year due to limited activity.
Ancaster & Flamborough – Upper-End Market Snapshot
These areas continue to define Hamilton’s upper-tier market, each posting average prices well above $1 million.
- Ancaster (Area 42): $1,052,143 (↓ 3%)
- Flamborough (Areas 40, 43–45): $1,273,077 (↑ 9%)
Standout Insight: Flamborough recorded one of the strongest increases across all districts this month, reinforcing persistent demand for rural and estate-style properties.
What This Means for Buyers and Sellers
November’s pricing trends show uneven adjustments across Hamilton. The Mountain remains the most active district, Hamilton West shows pockets of strength, and Ancaster and Flamborough continue to anchor the upper-end market. These variations highlight where buyer opportunities and strategic pricing considerations matter most heading into year-end.
Summary & Expert Insights: Hamilton Real Estate Market
November closed with 624 residential sales across the region, reflecting a typical seasonal slowdown and activity levels still below long-term averages. New listings eased, bringing the sales-to-new listings ratio to 50 per cent, while elevated inventory continued to support balanced-to-buyer-leaning conditions. Hamilton’s benchmark price settled at $688,300, an eight per cent decline year-over-year, with apartment and townhouse segments seeing the most significant adjustments.
“We’re seeing a more balanced market right now, giving buyers more breathing room than in previous years,” says Nicolas von Bredow, Cornerstone spokesperson. “Inventory remains higher than long-term trends, which is creating real opportunities for those who’ve been waiting for the right moment.”
What This Means for You
- Buyers: More choice and stronger negotiating conditions across several districts.
- Sellers: Pricing strategically remains essential as buyers compare more options.
- Investors: Softer prices in select segments may offer new opportunities.
Moving Forward
As the market continues to adjust, the guidance of an experienced, community-focused REALTOR is essential. Judy Marsales Real Estate Brokerage is here to help you make informed decisions—whether you’re buying, selling, or planning your next move.
Ready to Buy or Sell in Hamilton? We’re Here to Help
Whether you're preparing for a move, searching for the right home, or assessing investment opportunities, Judy Marsales Real Estate Brokerage is your trusted partner in Hamilton real estate. With more than 37 years of community-focused experience, our team provides the local insight, market knowledge, and personalized guidance you need in today’s evolving conditions.
Why Work With Us
- Tailored Support: From first-time buyers to long-time homeowners, we’re here for every stage of your journey.
- Local Expertise: Deep understanding of Hamilton’s neighbourhoods, pricing trends, and inventory levels.
- Real-Time Listings: Stay connected to the newest homes, stats, and market activity across Hamilton, Ancaster, and Dundas.
Stay Connected
Follow us on Facebook and Instagram for:
- Monthly market updates
- New listings and open houses
- Local stories and community insights
Get in Touch
Curious about your home’s value? Try our free Home Value Calculator for an instant estimate. Looking for deeper insights? Explore Cornerstone’s full November market report for comprehensive regional trends.
Make your next move with confidence — partner with Judy Marsales Real Estate Brokerage, trusted experts in Hamilton’s real estate community.
November 18, 2025
Erin
Local Hamilton Market Statistics Real Estate Trends

Hamilton Real Estate Market Update – October 2025
The Cornerstone Association of REALTORS® (Cornerstone) has released its October 2025 real estate market statistics, revealing a market still adjusting to elevated supply and shifting economic conditions. A total of 757 homes were sold across Hamilton, Burlington, Haldimand County, and Niagara North, just slightly below September’s figure but still 34% under typical October levels. While activity remains steady month-to-month, year-over-year comparisons continue to show a slower fall season.
This Hamilton real estate market update for October 2025 will highlight:
- Key insights for buyers, sellers, and investors navigating changing conditions.
- Sales, new listings, and pricing activity across Hamilton and surrounding communities.
- Neighbourhood-level trends that are shaping market performance this fall.
High inventory continues to influence pricing, even after the recent Bank of Canada policy rate cut. “Persistently high supply levels compared to sales have put downward pressure on home prices this month,” says Nicolas von Bredow, Cornerstone spokesperson for the Hamilton-Burlington market area. “Many were hopeful the rate cut would attract more buyers; however, slowing economic conditions and a decrease in migration are likely continuing to weigh on confidence.”
New listing activity eased in October, with 1,778 homes added to the MLS® System, improving the sales-to-new listings ratio to 43%. This helped prevent further inventory gains, though overall supply remained steady at five months. Pricing also held stable. The unadjusted benchmark price reached $747,200, nearly unchanged from September but still nine per cent below October 2024.
As Cornerstone notes, conditions vary widely across local neighbourhoods and property types, highlighting the importance of working with a REALTOR® who understands area-specific trends. The statistics in this report are sourced from the ITSO MLS® System and reflect broader market patterns across the region.
Coming Up: A Closer Look at Hamilton’s Housing Market
Next, we’ll break down Hamilton’s residential sales performance, pricing trends, and district-level dynamics heading into late fall.
Hamilton Residential Real Estate – Price, Sales & Market Conditions
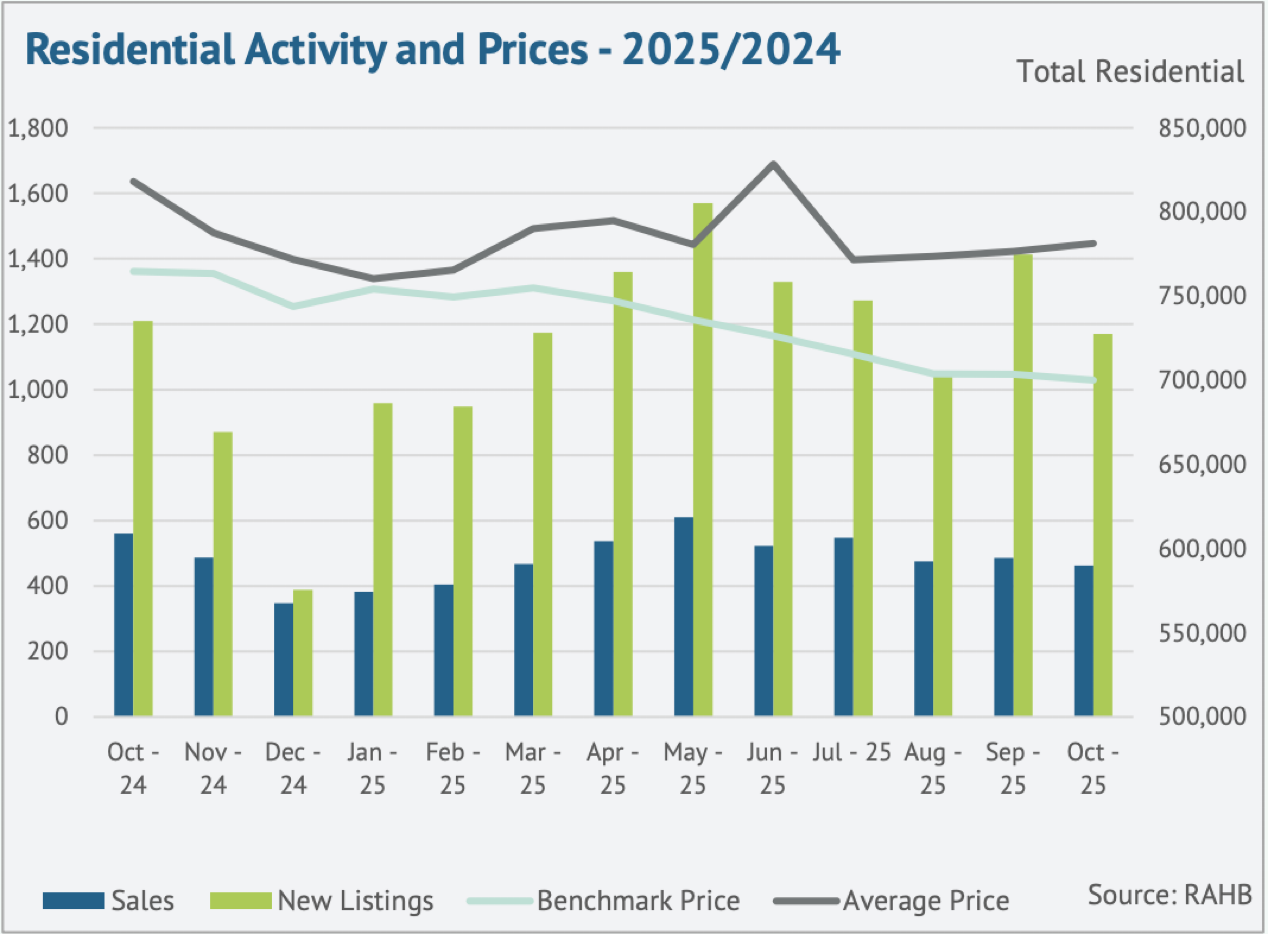
Hamilton’s residential real estate market saw a softer pace in October, with 463 sales across the city, a 17.3% decline year-over-year, and 12 fewer sales than September. Elevated supply and persistent affordability challenges continue to influence buyer behaviour heading into late fall. The average residential sale price reached $781,277, down 4.5% year-over-year, reflecting a market that is adjusting to higher inventory and more cautious demand.
While detached and semi-detached homes remain key contributors to overall activity, market conditions continue to favour buyers as supply levels outpace sales across several property types.
Inventory and Listing Activity
October saw a slowdown in new listings, which helped prevent additional inventory gains. Even so, supply levels remain elevated across several property types.
- New listings slowed: helping curb further increases in inventory.
- Sales-to-new listings ratio: 40%, indicating buyer-favouring conditions.
- Months of supply: 5 months, consistent with broader inventory buildup this fall.
- Oversupply pressure: Most evident in apartment-style and row-home segments.
- Most balanced submarket: Dundas, with 3 months of supply and a 63% sales-to-new listings ratio.
- Market variation: Conditions differ widely between neighbourhoods based on property type and supply levels.
Overall, supply levels continue to outpace demand in many segments, keeping the fall market balanced to slightly buyer-leaning.
Pricing Trends and Buyer Conditions
Elevated supply continued to weigh on prices in October, with varied impacts across Hamilton’s property types.
- Unadjusted benchmark price was $700,100:
- Slight month-over-month dip
- Down over 8% year-over-year
- Price adjustments by type:
- Apartment-style homes declined 14% year-over-year (largest decline)
- Detached homes declined 7% year-over-year
- Buyer conditions strengthened: More choice, longer decision windows, and increased negotiation leverage.
- Days on market: Increased, reflecting slower-moving fall activity.
These trends point to a market where pricing remains sensitive to supply, especially in higher-density segments with elevated inventory.
Looking Ahead: Property Type Breakdown
This concludes the overview of Hamilton’s residential market performance for October 2025. Next, we’ll explore how detached, semi-detached, townhome, and apartment-style properties performed individually, providing a clearer view of where opportunities may be emerging for buyers and sellers as we move toward year-end.
Hamilton Real Estate: Breakdown by Property Type – October 2025
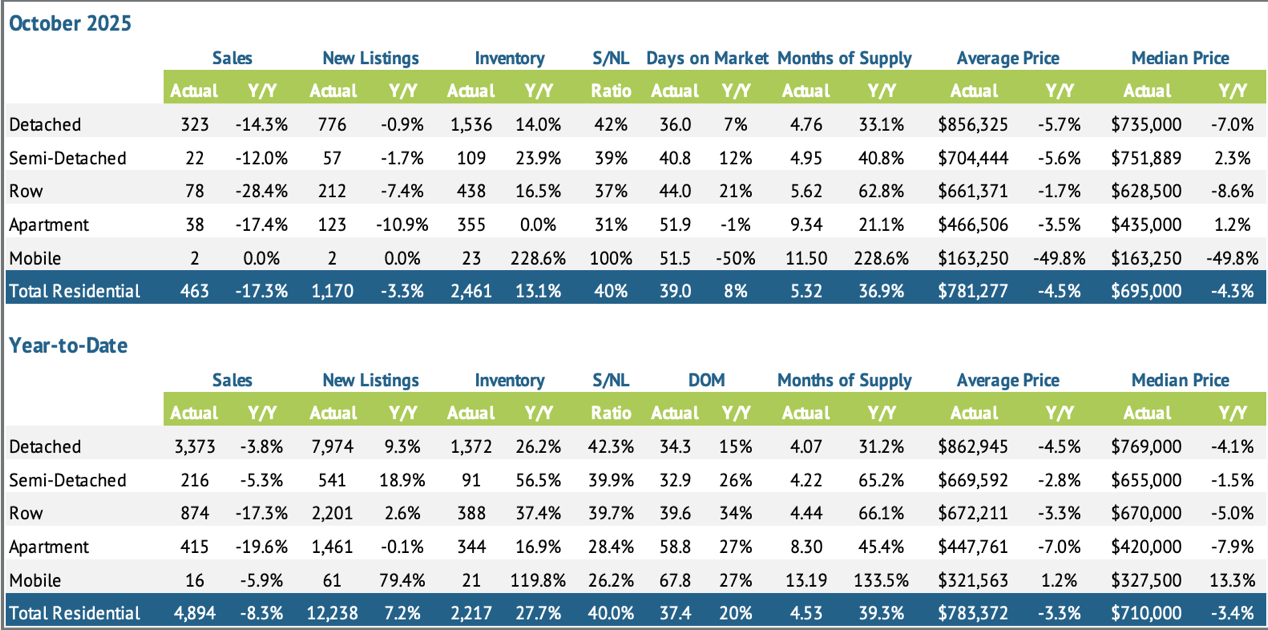
October revealed clear differences in performance across Hamilton’s major property types. Detached homes continued to dominate total sales, while townhomes and apartments saw sharper declines. Inventory levels remain elevated in several segments, keeping pricing and days on market under downward pressure. Overall, the data reflects a fall market still shaped by high supply, affordability constraints, and cautious buyer behaviour.
Detached Homes
- Sales: 323 (↓ 14.3% YoY)
- New Listings: 776 (↓ 0.9%)
- Inventory: 1,536 (↑ 14%)
- Average Price: $856,325 (↓ 5.7%)
- Benchmark Price: $765,900 (↓ 7%)
Detached homes remain the most active segment, though sales softened and price adjustments continued as inventory rose.
Semi-Detached Homes
- Sales: 22 (↓ 12% YoY)
- New Listings: 57 (↓ 1.7%)
- Inventory: 109 (↑ 23.9%)
- Average Price: $704,444 (↓ 5.6%)
- Benchmark Price: $695,500 (↓ 5%)
Semi-detached activity slowed in October, with rising inventory and fewer new listings contributing to more cautious buyer movement and moderate price declines.
Row (Townhomes)
- Sales: 78 (↓ 28.4% YoY)
- New Listings: 212 (↓ 7.4%)
- Inventory: 438 (↑ 16.5%)
- Average Price: $661,371 (↓ 1.7%)
- Benchmark Price: $610,400 (↓ 5%)
Townhome demand declined sharply year-over-year. With supply increasing and new listings easing, market conditions remained competitive for sellers and continued to favour strategic pricing.
Apartments & Condos
- Sales: 38 (↓ 17.4% YoY)
- New Listings: 123 (↓ 10.9%)
- Inventory: 355 (no change)
- Average Price: $466,506 (↓ 3.5%)
- Benchmark Price: $402,900 (↓ 14%)
Apartments recorded the steepest benchmark decline among all property types, driven by elevated supply, affordability shifts, and slower absorption rates.
Coming Up: Regional Summary
Next, we’ll move into a regional breakdown across Hamilton’s key areas — including Hamilton Mountain, Stoney Creek, and Hamilton Centre — to show where demand is strengthening, softening, or balancing out as we head toward the end of 2025.
Regional Summary – October 2025
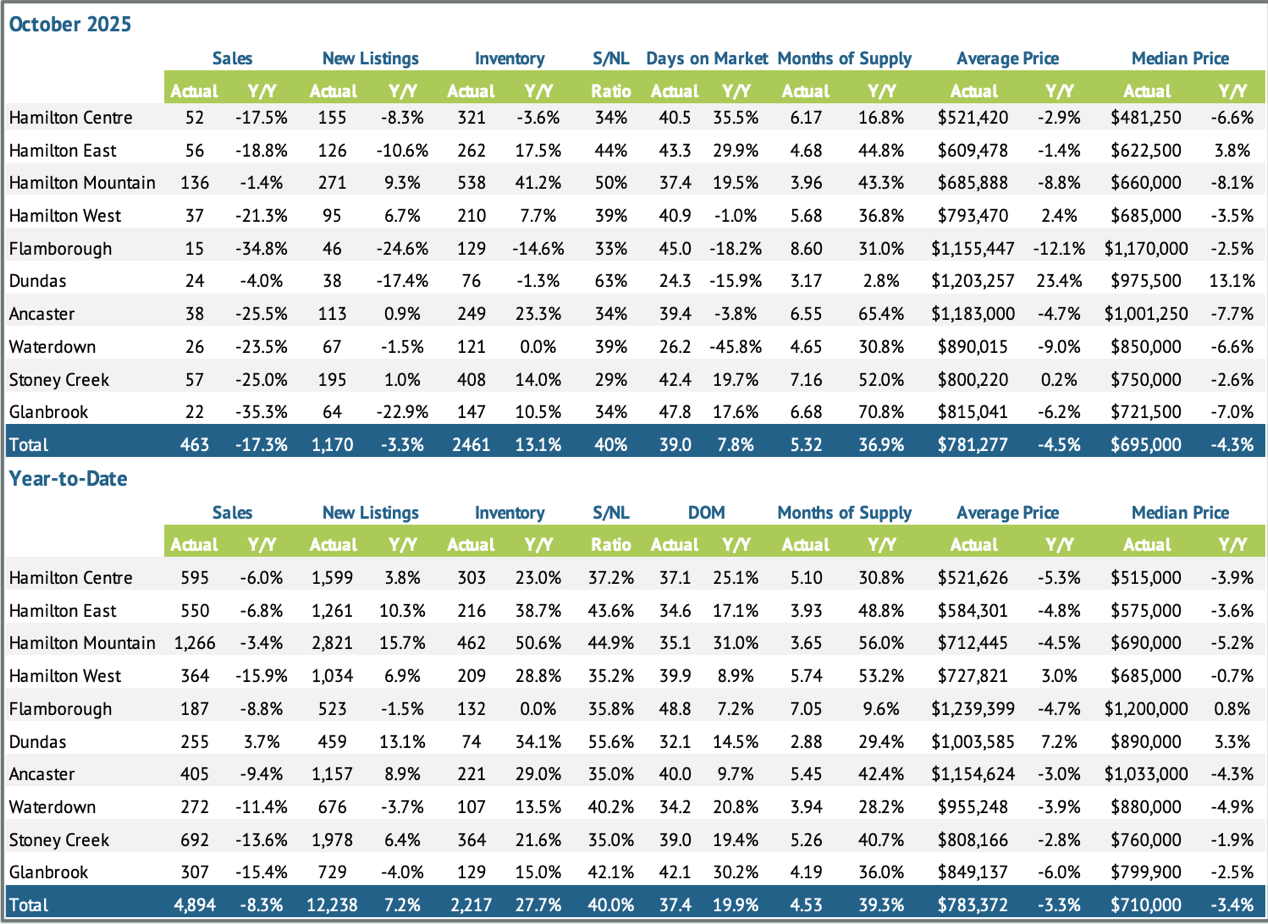
Hamilton’s housing market showed noticeable variation across key areas in October, with Hamilton Mountain once again leading the city in both sales and inventory. Stoney Creek and Hamilton Centre also saw elevated supply levels, contributing to slower absorption rates and increasing buyer choice. At the same time, Flamborough, Dundas, and Ancaster each posted average home prices above $1 million, highlighting the continued strength of Hamilton’s upper-end market despite softer sales activity.
Overall, these trends reinforce a fall market shaped by rising supply, price adjustments, and more negotiating power for buyers across several neighbourhoods.
Hamilton Mountain
Hamilton Mountain remained Hamilton’s highest-volume district, leading the city in both sales and active listings.
- Sales: 136 (↓ 1.4%)
- New Listings: 271 (↑ 9.3%)
- Inventory: 538 (↑ 3.6%)
- Months of Supply: 3.96
- Average Price: $685,888 (↓ 8.8%)
With strong activity but growing inventory, the Mountain continues to offer a wide range of options for buyers, contributing to balanced conditions heading into year-end.
Stoney Creek
Stoney Creek saw softer sales in October but posted one of the highest inventory levels city-wide, second only to Hamilton Mountain.
- Sales: 57 (↓ 25%)
- New Listings: 195 (↑ 1%)
- Inventory: 408 (↑ 14%)
- Months of Supply: 7.16
- Average Price: $800,220 (↑ 2%)
Elevated supply and rising months of inventory continue to support buyer-friendly conditions, even as the average price saw a modest year-over-year increase.
Hamilton Centre
Hamilton Centre experienced slower sales alongside one of the highest months-of-supply totals in the city.
- Sales: 52 (↓ 17.5%)
- New Listings: 155 (↓ 8.3%)
- Inventory: 321 (↑ 3.6%)
- Months of Supply: 6.17
- Average Price: $521,420 (↓ 2.9%)
Higher inventory and moderate price adjustments continue to make Hamilton Centre one of the most accessible and negotiable areas for buyers this fall.
Upper-End Market Snapshot: Flamborough, Dundas & Ancaster
Flamborough, Dundas, and Ancaster each held firmly in Hamilton’s luxury tier in October, recording average home prices above $1 million. Flamborough reported an average price of $1,155,447 (↓ 12.1%), supported by 15 sales and 8.60 months of supply, indicating slower absorption in this rural high-end segment. Dundas, the most balanced of the three, posted 24 sales, 3.17 months of supply, and an average price of $1,203,257, reflecting strong demand and notable price resilience. Ancaster saw 38 sales, 6.55 months of supply, and an average price of $1,183,000 (↓ 4.7%), supported by steady listing activity and ongoing upper-market appeal.
Together, these areas continue to define Hamilton’s premium housing market, where million-dollar pricing remains a consistent feature despite shifting sales volumes and evolving fall market conditions.
Looking Ahead: Average Residential Prices by District
Next, we’ll take a closer look at average residential sale prices by district, continuing our focus on Hamilton Mountain, Stoney Creek, and Hamilton Centre. This breakdown will highlight how pricing is shifting in the city’s most active and supply-sensitive areas as we move deeper into the fall market.
Average Residential Prices by District – October 2025
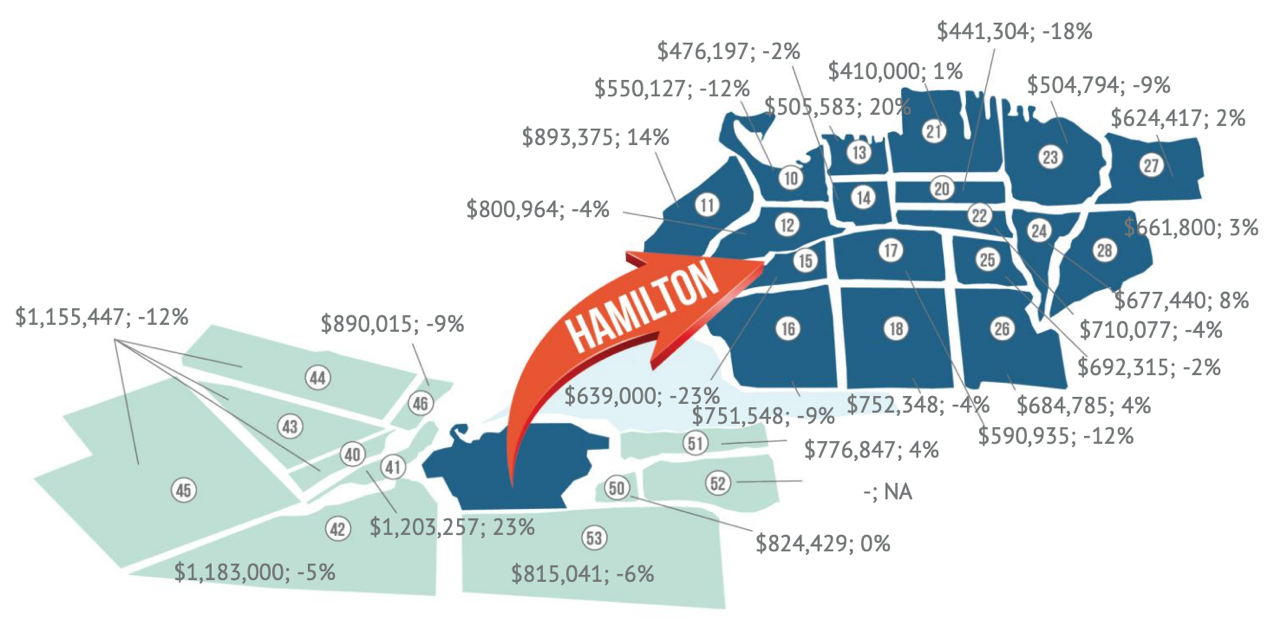
Average sale prices across Hamilton’s districts continued to vary widely in October, highlighting a market where some neighbourhoods are still adjusting while others are showing signs of stability. This month, we’re again focusing on Hamilton Mountain, Stoney Creek, and including Hamilton Centre. These three regions that stand out for their activity levels, inventory supply, and the diversity of price movement across their sub-areas.
Understanding these micro-trends gives buyers and sellers a clearer picture of where opportunities may emerge and where strategic pricing will be most important this fall.
Hamilton Mountain Sub-Area Breakdown
Hamilton Mountain (Areas 15, 16, 17, 18, 25, 26) remained the city’s strongest overall district in terms of sales and inventory. Price adjustments continued across most sub-areas, with one exception.
- Area 15: $639,000 (↓ 23%)
- Area 16: $751,548 (↓ 9%)
- Area 17: $590,935 (↓ 12%)
- Area 18: $752,348 (↓ 4%)
- Area 25: $692,315 (↓ 2%)
- Area 26: $684,785 (↑ 4%)
Standout Insight: Area 26 was the only Mountain sub-area to post a price increase this month, while Area 15 experienced the steepest decline, emphasizing how pricing conditions differ even within the city’s highest-activity district.
Stoney Creek Sub-Area Breakdown
Stoney Creek (Areas 50, 51, 52) saw a mix of stability and growth in October, with two sub-areas reporting steady or rising prices.
- Area 50: $824,429 (0%)
- Area 51: $776,847 (↑ 4%)
- Area 52: NA
Standout Insight: Area 51 continued to show upward movement with a 4% year-over-year gain, while Area 50 held steady — a positive sign in a district with one of the highest months-of-supply totals in the city.
Hamilton Centre Sub-Area Breakdown
Hamilton Centre (Areas 13, 14, 20, 21, 22) recorded some of the city’s sharpest contrasts, with several declines offset by a notable gain in Area 13.
- Area 13: $505,583 (↑ 20%)
- Area 14: $476,197 (↓ 2%)
- Area 20: $441,304 (↓ 18%)
- Area 21: $410,000 (↑ 1%)
- Area 22: $710,077 (↓ 4%)
Standout Insight: Area 13’s 20% increase was the strongest gain across all Hamilton Centre sub-areas, while Area 20 saw the most significant decline, illustrating the wide pricing range within this centrally located district.
What This Means for Buyers and Sellers
October’s district-level pricing shows that Hamilton continues to adjust unevenly, with some areas stabilizing and others experiencing more pronounced shifts. Hamilton Mountain remains the city’s core driver of activity, Stoney Creek is showing resilience in select sub-areas despite high supply, and Hamilton Centre offers some of the city’s most accessible price points alongside isolated pockets of growth. For buyers, these variations open up new opportunities; for sellers, thoughtful pricing and market-specific strategies remain key as the fall market progresses.
Summary & Expert Insights – Hamilton Real Estate Market
October 2025 closed with 757 residential sales across the Hamilton, Burlington, Haldimand County, and Niagara North region—slightly below September and well under long-term seasonal averages. New listings eased to 1,778, improving the sales-to-new listings ratio to 43%, while overall inventory held steady at five months of supply, reinforcing the balanced-to-buyer-leaning conditions seen throughout the fall.
The region’s unadjusted benchmark price reached $747,200, holding steady month-over-month but remaining nine per cent below last year. Within Hamilton, the benchmark price dipped to $700,100, while the average residential price settled at $781,277, a 4.5% year-over-year decline, reflecting the broader softness across several property types.
“High supply compared to sales continues to shape pricing this month,” says Nicolas von Bredow, Cornerstone spokesperson. “While activity has been steady, many buyers remain cautious due to economic conditions, which is contributing to more balanced market dynamics.”
What This Means for You
- Buyers: More choice, more time, and more negotiating power—particularly in areas with elevated inventory such as Hamilton Mountain, Stoney Creek, and Hamilton Centre.
- Sellers: Strategic pricing remains essential as buyers compare more options and market conditions continue to favour balance.
- Investors: Price adjustments in select segments may offer new opportunities as the market stabilizes.
Moving Forward: Expert Support for Every Step
As market conditions continue to evolve, having the guidance of a knowledgeable, community-rooted real estate expertise is essential. With decades of experience across Hamilton’s diverse neighbourhoods, our sales representatives are here to help you make informed, confident decisions—whether you’re planning to buy, sell, or simply assess your next steps.
Ready to Buy or Sell in Hamilton? We’re Here to Help
Whether you're preparing to make a move, searching for the right home, or exploring investment opportunities, Judy Marsales Real Estate Brokerage is your trusted partner in Hamilton real estate. With more than 37 years of community-focused experience, our brokerage offers the local insight, market knowledge, and personalized guidance you need in today’s evolving conditions.
Why Work With Us
- Tailored Support: From first-time buyers to long-time homeowners, we’re here for every stage of your journey.
- Local Expertise: Deep understanding of Hamilton’s neighbourhoods, pricing trends, and inventory levels.
- Real-Time Listings: Stay connected to the newest homes, stats, and market activity across Hamilton, Ancaster, and Dundas.
Stay Connected
Follow us on Facebook and Instagram for:
- Monthly market updates
- New listings and open houses
- Local stories and community insights
Get in Touch
Curious about your home’s value? Try our free Home Value Calculator for an instant estimate. Looking for deeper insights? Explore Cornerstone’s full October market report for comprehensive regional trends.
Make your next move with confidence — partner with Judy Marsales Real Estate Brokerage, trusted experts in Hamilton’s real estate community.